
Budget 2023 Public Perception Survey

Article byIDEA Consulting Research TeamPublished on Mon Oct 24 202214 minute read
Executive Summary
The 2023 Malta Budget Public Perception Survey, presented by Malta Survey, carried out research to identify the public needs and sentiments prior to the said budget being presented by the Government. The findings of the survey include the following:
- A significant need for wages to be reviewed was identified; and
- The need for Government Authorities and Agencies to make better use of funds was discovered; and
- The Environment was found to be the highest priority sector to be addressed in this budget; and
- An overall sentiment of uncertainty (neither positivity nor negativity) towards the budget was expressed by the collected sample.
Introduction
The aim of this survey is to scientifically assess public opinion about the budget for 2023. More specifically, this survey, which has been compiled after desk research on the significant issues discussed by the general public, looks into what the general public feels are the matters of concern and how Government should address the current issue.
Maltasurvey.com is the only public space where citizens can freely and voluntarily voice their concerns on different topics. This site is entirely independent of any political party or media organisation. We aim to use this platform to bring general ideas and perceptions to the fore and then evaluate the responses in the current social context.
The Malta Budget 2023 Public Perception Survey is divided into four sections. In addition to the basic demographic understanding, the survey looked into
(a) matters of concern,
(b) priorities to be addressed
(c) ideas for meeting the current deficit
(d) general opinion on whether this budget will meet personal needs.
Methodology
Data Gathering & Analysis
The online survey was carried out between the 4th and the 16th of October 2023.An online invitation was sent on social media platforms and all participants opted to voice their opinion voluntarily.
Data was gathered through this platform and complete anonymity was ensured. Some participants, however, opted to submit their e-mails asking for further participation and results. The responses of these participants were not identified. Analysis was done using Data Science tools including Python, Julia and Jupyter Notebooks.
Margin of error
As of April 11, 2022, Malta had a total of 355, 075 registered voters. With a sample size of 1,611 participants, the findings mentioned below have a margin of error of 2% at a 95% confidence level.
Findings
Section 1: Demographic analysis of the sample population
The sample consists of 1,611 participants composed of 60.5% females, 38.4% males and 1.1% opted not to disclose their gender. The sampled cohort can be described as being the average to the above average income earner between €20K to €40K, mostly between the 31 to 50 age group, with post-secondary level education.
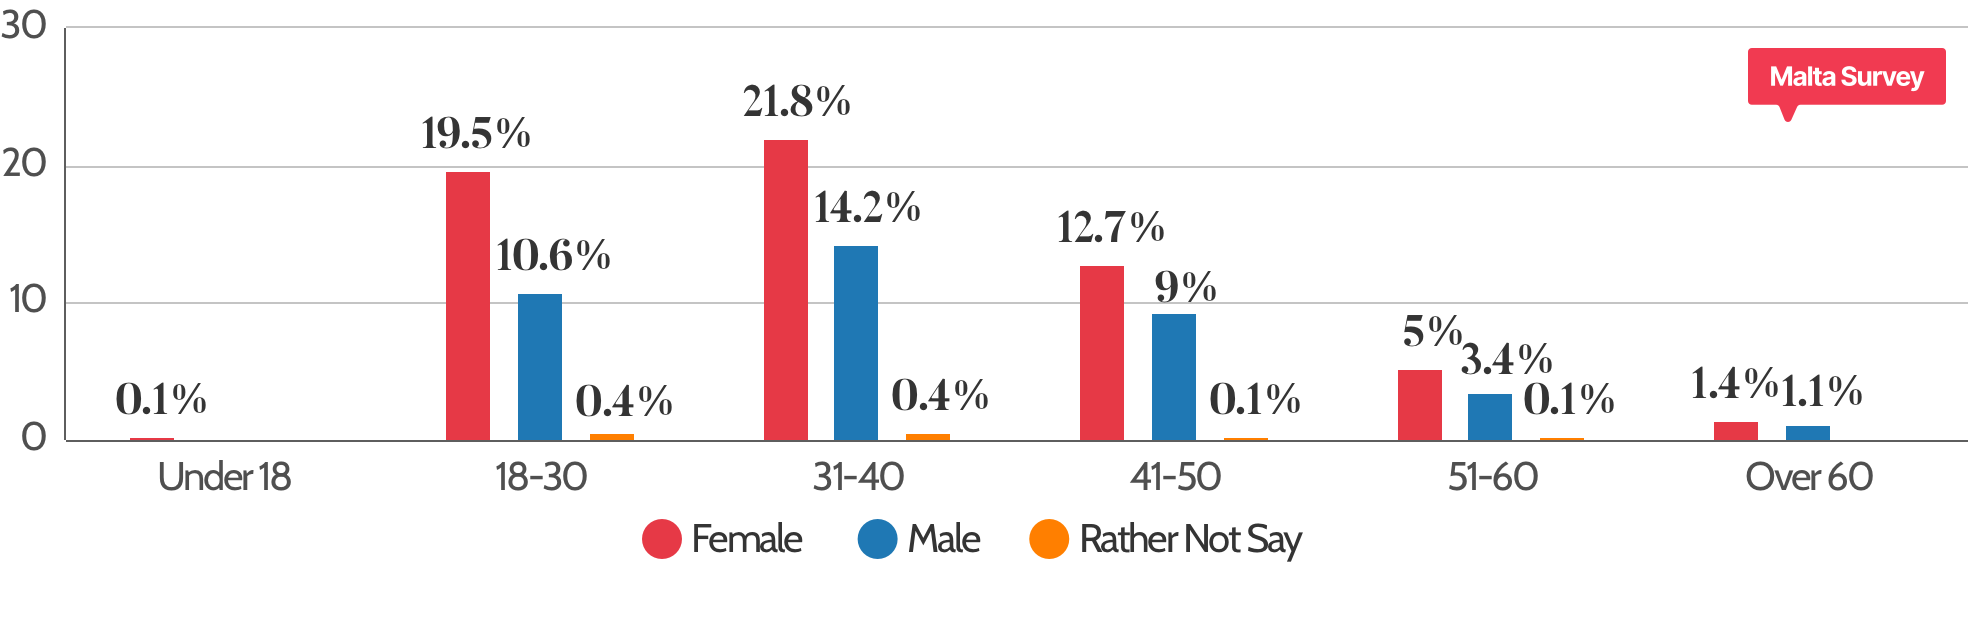
The survey mostly attracted participants between 18 and 50 years of age. This is an interesting cohort since people at this age are directly and/or indirectly contributing to the national economic growth and welfare of the country.

Interestingly enough, the majority of participants claimed four categoric roles, including managerial, professional as well as skilled, and clerical. This is a well-distributed sample of the national workforce in Malta and Gozo.
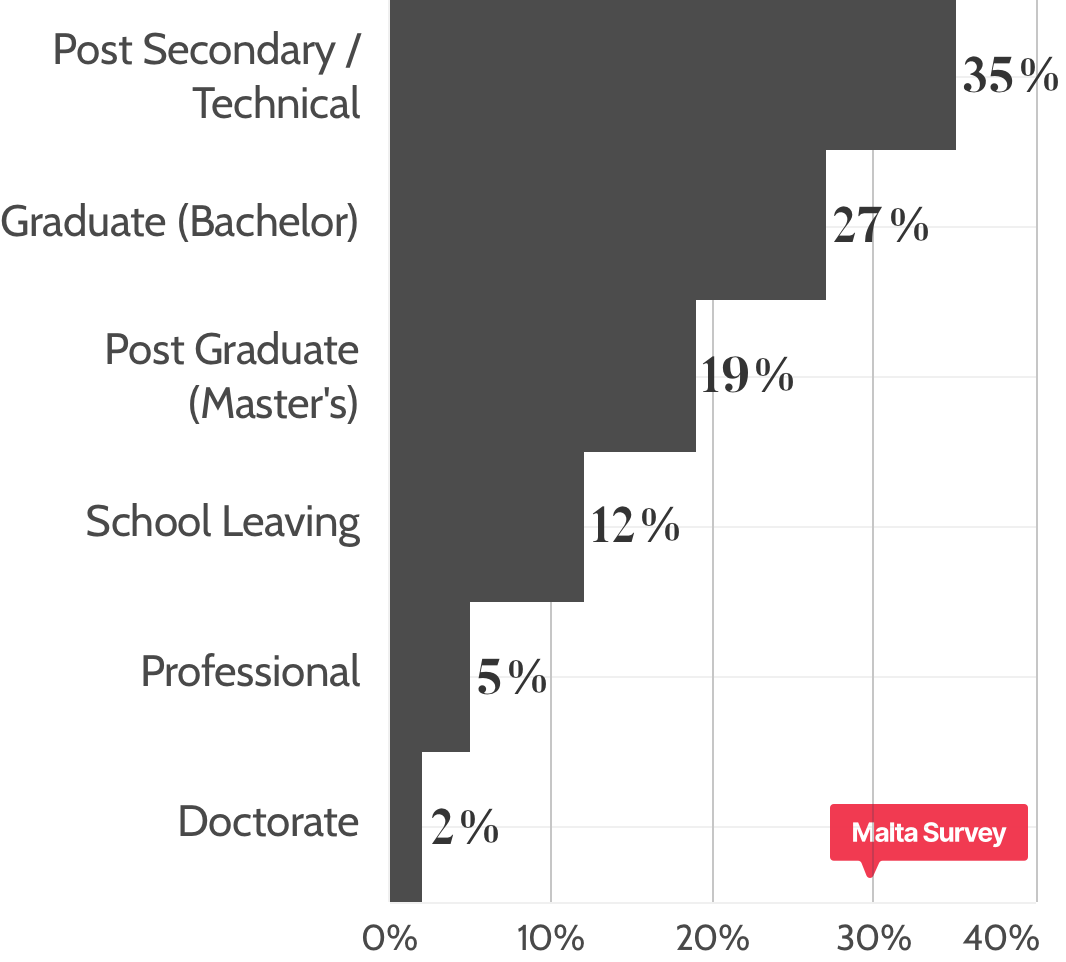
In terms of education, the most common maximum education level in this sample is made up of people with a post-secondary/technical certificate. The following two groups are those with a Bachelor’s degree and a Master’s degree, respectively.
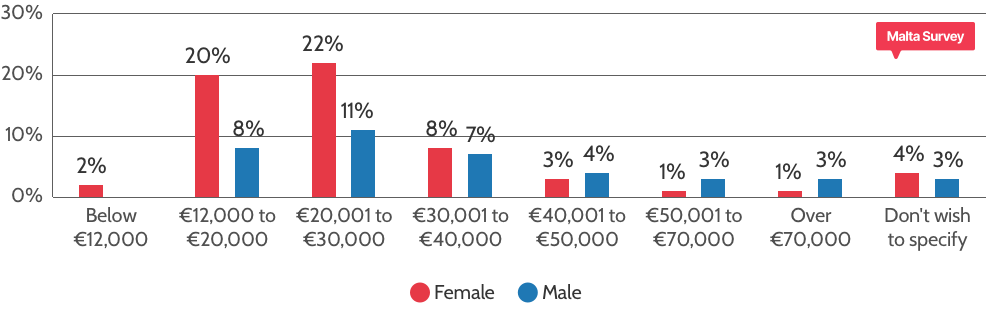
The income distribution shows that the sample coincides with the previously exhibited average income figures. In addition, the only areas where there is a male majority in an income group is for any income over €40,000 despite the sample having 60% female participation.


When assessing the distribution of the participants’ income by education, the highest concentration is observed by those with a post-secondary/technical education level with an income between €12,000 and €30,000. This is followed by the income bracket of €20,001 to €30,000 occupied by those with a Bachelor’s degree.
Examining the distribution of income by occupation, this concentration of income between €12,000 and €30,000 is mostly occupied by participants currently in clerical/administrative roles, skilled workers and professionals.
Section 2: Needs Assessment
This section addresses three major questions, all intended to assess the budget sentiment of the general public.
2.1: Assessing the most sought-after measures
By looking into the most sought-after measure(s) one truly identifies what the general public feels that Government should address in Budget 2023. In pursuit of having an organised assessment, the following possibilities were provided and participants were asked to prioritise three areas of major concern that they would like Government to address.
- A review of the wage structures
- A review of the rent situation
- A review of property prices
- Control of food prices
- Control on medicinal prices
- A lowering of tax bands
- A review of social benefits
- A review of subsidies given to families
- A review of subsidies given to businesses
- Give more one-time bonuses
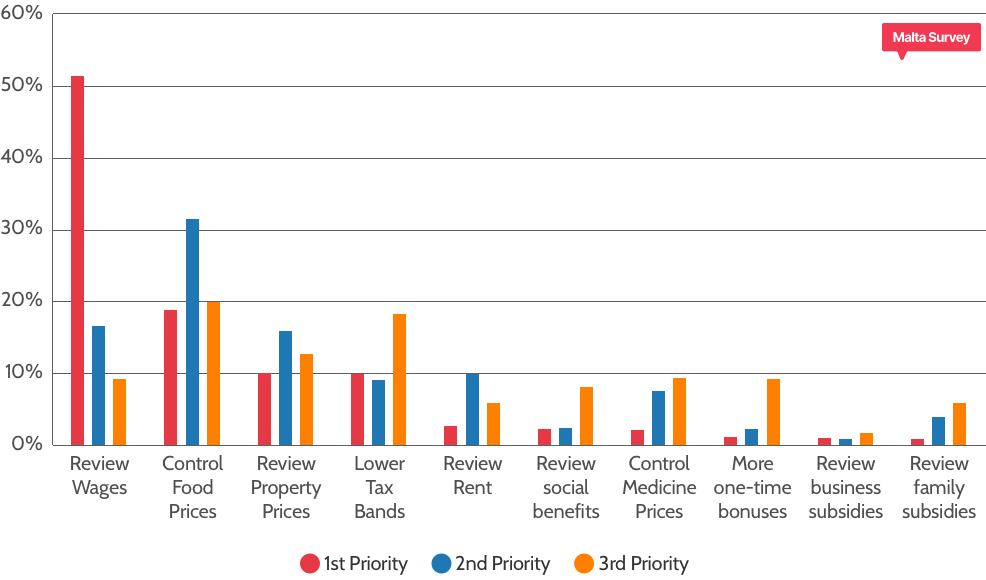

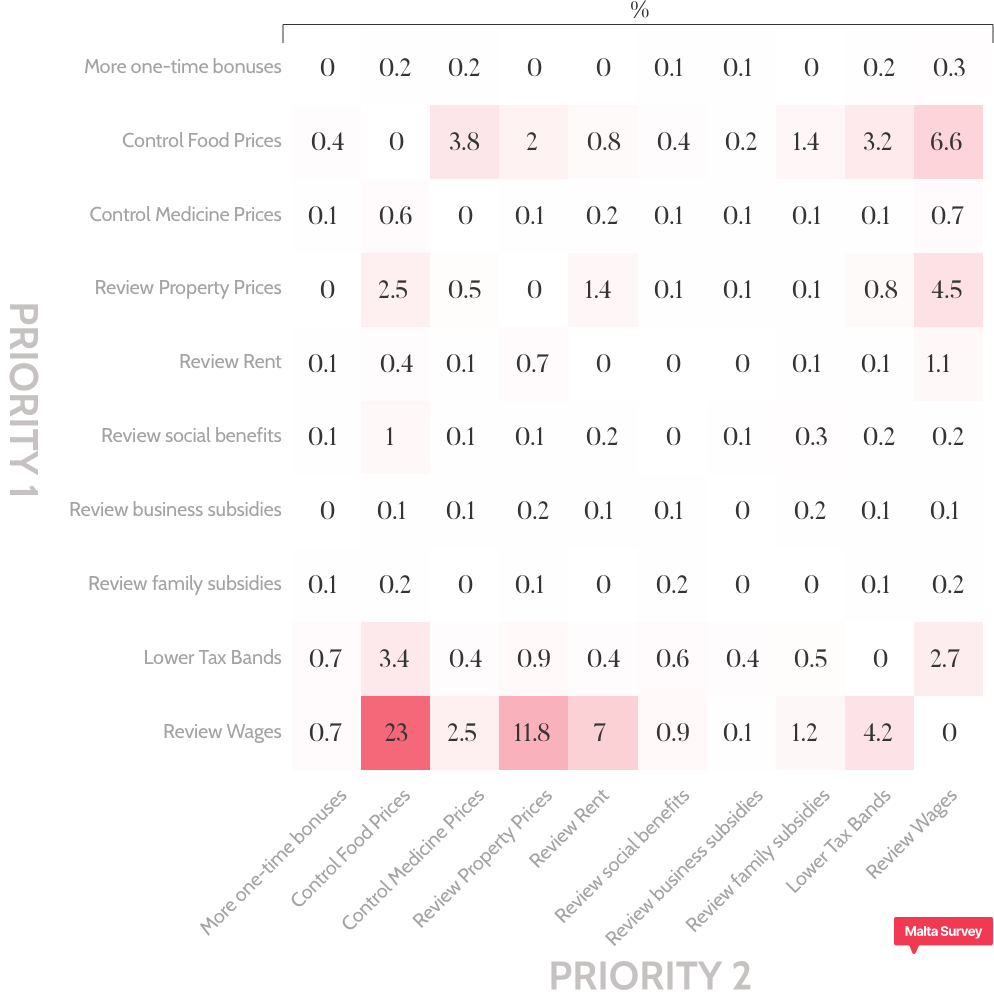
The results clearly show that there are three areas of concern, namely
- review wages with 51.4 % as the first priority
- control cost of food prices with almost 19% as the first priority and almost 32% as the second priority
- two other factors namely control of property prices & revision of tax bands are almost identical with 10% as the first priority.
The heatmap of the first and second priority choices shows how the major concentration of the sample is placing wages as its first priority and food prices as its second priority. This concentration almost makes up a quarter of the entire sample. The other two noticeable concentration groups both also have wage review as their first priority and property prices and rent review as their second priority with 11.8% and 7% respectively. The group that placed food price control as a first priority and a review of wages as the second priority occupies 6.6% of the sample’s population.
Looking into these results it becomes overtly clear that even though the sample is above the average wage earner, the major issue of concern is the increase in the cost of living and ensuring enough cash to meet daily needs. It would be interesting to assess whether the increase in the take-home pay would have been met with an increase in disposable income. On the contrary, the latter has decreased, and Government is completely aware of this new reality. To this effect, the Minister of Finance had already stated that Government will immediately address these concerns to ensure that those within the poverty line are addressed.
2.2: Assessing the measures to control the deficit
This survey gave the opportunity to participants to have their say in what they think are the correct measures to be taken by Government in order to control the deficit. The following options were addressed and participants were asked to prioritise the first three.
The following options were presented:
- Rationalise social benefits by developing tighter means-testing
- Control the spending of Government Agencies and/or Authorities
- Gradually reduce the number of employees in the public sector
- Rationalise assistance given to businesses
- Reduce the spending on national projects

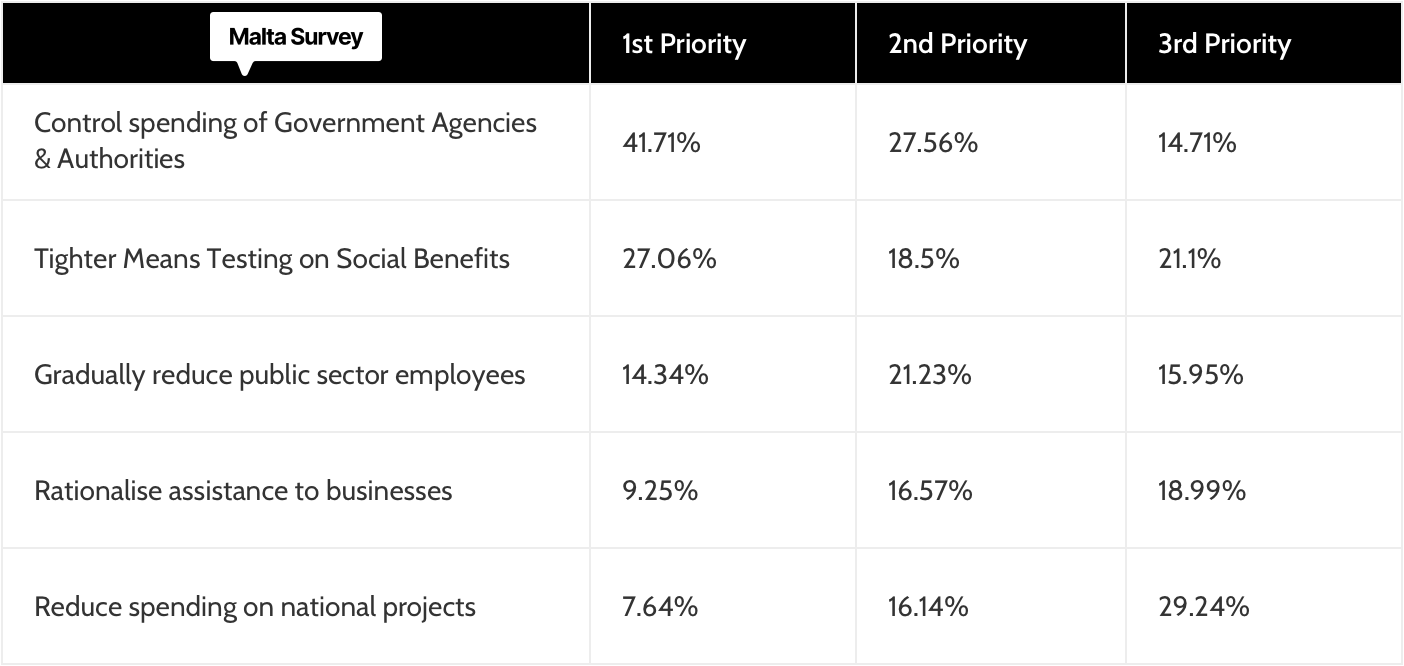
The general perception of the surveyed population shows that there is a concern about the way Government is using public funds through annual subventions given to different public entities with almost 42% as the priority. This is followed by tighter controls on means testing with a value of 27% as the first preference. The third preference is complete adherence and there should be tighter control on the complement levels of employees working in the public service and public sector.
These three responses are very congruent with each other and in analysing the results further one can also understand the underlying narrative that employees with moderate income are becoming more concerned about how Government spends the money. Indirectly one can argue that this calls for better governance and accountability.

When observing the heatmap between the first and second priorities for deficit control measures, the top three concentrations occur between the following pairs.

These results clearly show that there is a pattern and positive correlation between the three major concerns. This implies that on a general note, employees are becoming more concerned about how Government is administering public funds. Equally interesting however is that there is a silent group voicing concern about the current means-testing. This shows that there are underlying concerns of potential misuse of the system.
If one assesses the crosstab of the budget measure’s first priority and the deficit control’s first priority, it is evident that the highest concentrations are between those suggesting a wage review and the control of spending of Government Agencies and Authorities and the tighter means testing to provide social benefits.

2.3: Assessing the most important sector
The third and final priority-based question treated the sectors that the public believes that are to be given the utmost attention by the measures proposed in this year’s budget.The following options were given to the participants.
- Health
- Education
- Social Services
- Research, Development and Innovation
- Employment
- Infrastructure
- Environment
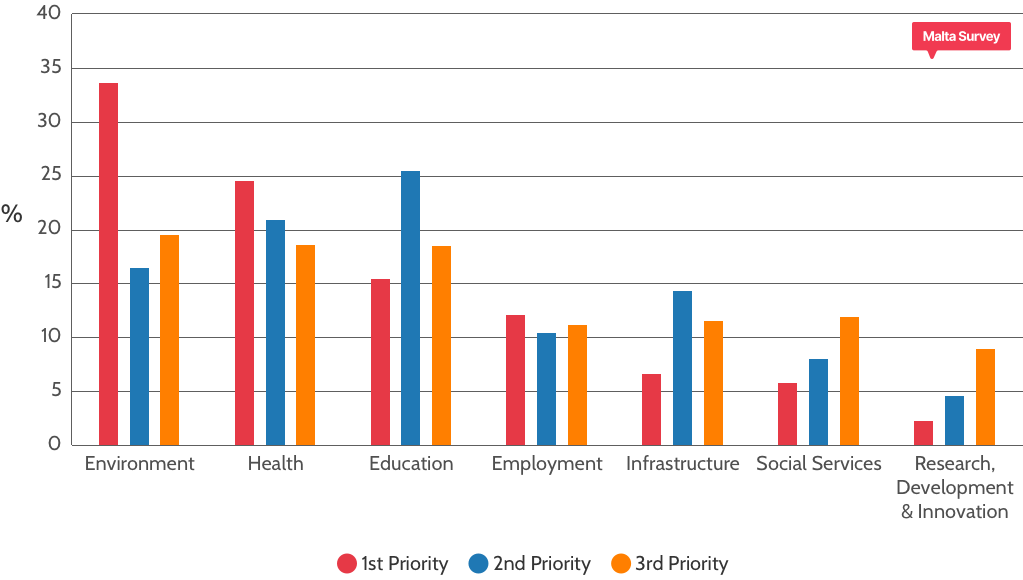

The environment occupies the majority portion of the first priority option with a substantial gap between itself and the next popular first priority choice, the health sector. In addition, the environment also topped the list of 3rd priority options with a marginal amount higher than the health and education sector. Education is the majority holder in the 2nd priority results with up to 5% more of a portion than the health sector. The sector holding the smallest portions throughout the options is the research, development and innovation sector.
A heatmap of the first priority sector, cross-referenced by age, shows how the environment is the first priority sector for all ages between 18 and 60. Health is the second most popular first-priority sector throughout these same age groups. When cross-referencing the second priority sector by age, one can observe how education is the most popular option between the ages of 18 and 60; equalling the portion of the health sector in the 51-60 demographic.
The survey results show that middle-aged employees are giving education more importance (from the heatmap of the second priority sector by age), perhaps being more cognisant that in pursuit of improving their career, they require higher education standard. The Maltese industry's competitiveness is dependent on the development of higher skills to meet the ever-changing requirements. It is worth noting that the Get Qualified Scheme is a key contributor to encourage employees to upgrade their competencies, thus also increasing their employability.


2.4: Assessing the sentiment towards Budget 2023
After having asked the participants about their needs in terms of measures, deficit control and sectors of focus, the final part of the survey treats the sentiment as to whether the participants believe that the 2023 Budget measures will address their needs. The answer structure was a basic 5-point scale from “Strongly Agree” to “Strongly Disagree”.
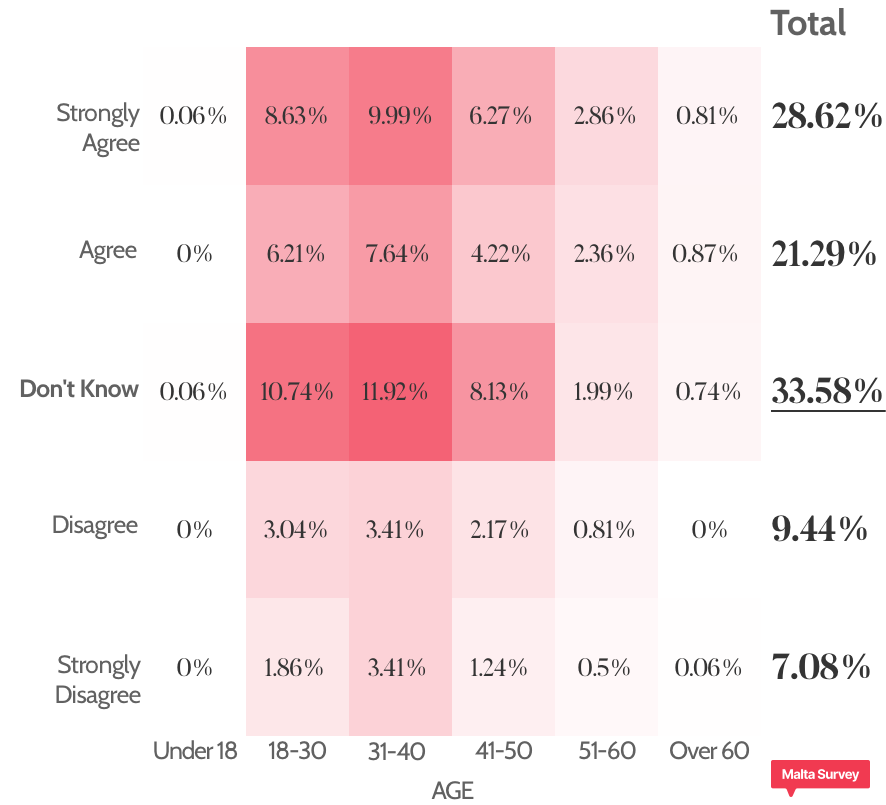
The majority sentiment was that of uncertainty (“Don’t Know”) with a portion of 33.58% of the sample. The age groups with a majority of uncertainty were those between 18 and 50. The next most popular sentiment groups were those of “Strongly Agree” and “Agree”.
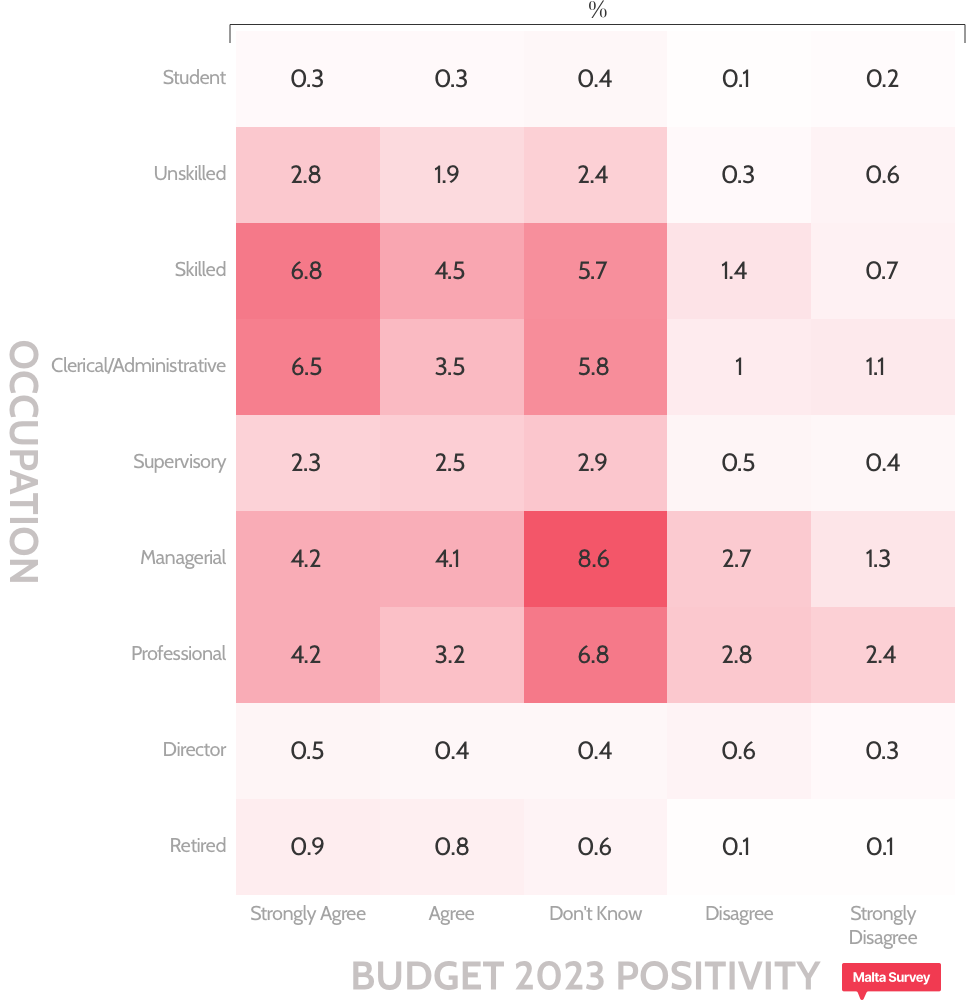
If one dissects the budget sentiment by occupation, it can be observed that the uncertain sentiment has a majority in the supervisory, managerial and professional roles. Whilst the strongest positivity occupies the majority amongst the unskilled, skilled, retired and clerical/administrative roles. The sentiment of disagreement is the most popular one amongst the director role.
Conclusion
Survey results are never meant to be seen as a conclusion, but on the contrary, any finding that is objective, factual and independent should be considered as another data point for policy makers in the country. These results are a true reflection of the peoples' beliefs about a subject that truly concerns them. It is high time that their ideas and beliefs should be equally heard.