
Budget 2026 Expectations

Article byIDEA Consulting Research TeamPublished on Wed Oct 22 202526 minute read
Executive Summary
Between 11-18 October 2025, MaltaSurvey ran its annual nationwide online poll to understand public expectations ahead of Budget 2026. The survey gathered 1,004 responses (±3.16% margin of error, 95% confidence). Entries underwent automated validation; questions were presented neutrally and were available in both Maltese and English. For ranking questions, results use a weighted 3-2-1 method (1st/2nd/3rd choice) to reflect both intensity and breadth of support.
The headline findings are as follows:
- Cost of living dominates: Using weighted ranks, the public's top measures are 1) Control food prices, 2) Review wage structures, 3) Review property prices, with more favourable employee tax bands close behind. Lower priority items include cuts on income tax for companies and business subsidies.
- Deficit reduction: The preferred fixes focus on expenditure discipline, namely, controlling spending by Government agencies/authorities, followed by tighter means-testing of social benefits.
- Where to invest: The sectors the public wants prioritised are Health (1st place), Environment (2nd place) and Education (3rd place).
- Confidence improved from last year, but is cautious: 28.7% are confident (13.2% highly confident and 15.5% somewhat confident), 30.3% are not sure, and 41.1% are not confident (24.5% not that confident, 16.6% not at all confident). The majority are either uncertain or sceptical that Budget 2026 will fully meet expectations.
- Age splits clarify the "why". First-priority choices show distinct life-stage pressures. Younger Maltese (16-30 years) place priority prices as their top concern, working-age (31-60 years) enlist wage structure review as their first priority, whilst older cohort (over 60 years) emphasise that food prices are paramount, reflecting day-to-day affordability on fixed incomes.
Survey Methodology
This online survey was carried out between the 11th and the 18th of October 2025. The survey was hosted on Malta Survey’s website - www.maltasurvey.com. Notice of its release was given through digital advertisements on social media platforms. No direct targeting or use of any pre-known datasets was done, thus protecting any identification of the sample’s participants. Each submission was verified through a series of automated checks and guards to prevent duplicate responses and ensure the legitimacy of the data. Participants had the option to carry out the survey either in Maltese or English, and an effort was made to ensure that all questions were neutral and non-leading. All submissions were gathered through Malta Survey’s platform, and the anonymity of the sample base was ensured. Analysis was done using data science tools.
The online survey had the following research questions:
- What are the important priorities that should be placed during the upcoming budget?
- What measures should the government take to reduce the current deficit?
- What economic sectors are to be prioritised during the upcoming budget?
- What is the confidence that this year’s budget will deliver on the expectations of the public?
Sampling & Weighting
Sampling was carried out using stratified methods to mirror the demographic composition of Malta’s electorate, including age, gender, region and education. Following sampling completion, statistical post-stratification weighting was applied to adjust for any discrepancies between the sample and the general population, ensuring that the results accurately reflect the views of the electorate as closely as possible.
Data Security & Privacy
Malta Survey adhered to strict protocols to protect the confidentiality and integrity of survey responses. All data transmissions are encrypted, and no personal information is stored in the survey’s dataset.
Limitations and Disclaimer
Whilst Malta Survey’s digital polling methodology is designed to minimise errors and biases, it is important to acknowledge potential limitations. The reliance on digital technology means that any individual without internet access may be potentially underrepresented. Despite efforts to ensure a representative sample, the self-selecting and fully voluntary nature of the respondents could introduce some level of response bias. However, like all survey methods, it is subject to certain inherent limitations that are diligently mitigated through the design and execution of the polling process.
Margin of Error
As of April 11, 2022, Malta’s population of people aged 16 years and over stood at 447,456. With a sample size of 1,004, the findings mentioned below have a margin of error of 3.16% at a 95% confidence level. Specific sub-divisions by demographics and/or specific cohorts will have larger margins of error due to the smaller size of the sample portion considered.
Priority Sorting
While previous Budget Expectations Reports considered ranking priorities solely by first preference, this approach is changing in favour of a weighted scoring method that incorporates all three ranking positions. Ranking by first preference alone, though straightforward, discards valuable information by ignoring second and third choices (Alwin & Krosnick, 1985). Instead, a weighted scoring system was applied where first-place selections received 3 points, second-place selections received 2 points, and third-place selections received 1 point. This approach aligns with established decision theory principles, particularly Saaty’s (1977) work on scaling methods for priorities in hierarchical structures, which demonstrates that weighted aggregation of ranking preference provides a more robust representation of overall priorities than single-position analysis. The weighted method captures not only the intensity of top preferences but also the breadth of support across all ranking positions, offering a more complete picture of respondents’ priority structures (Orme, 2009). By summing weighted scores across all respondents, the resulting ranking reflects both the strength and distribution of preferences throughout the sample.
Findings
Demographic Analysis of the Sample Population
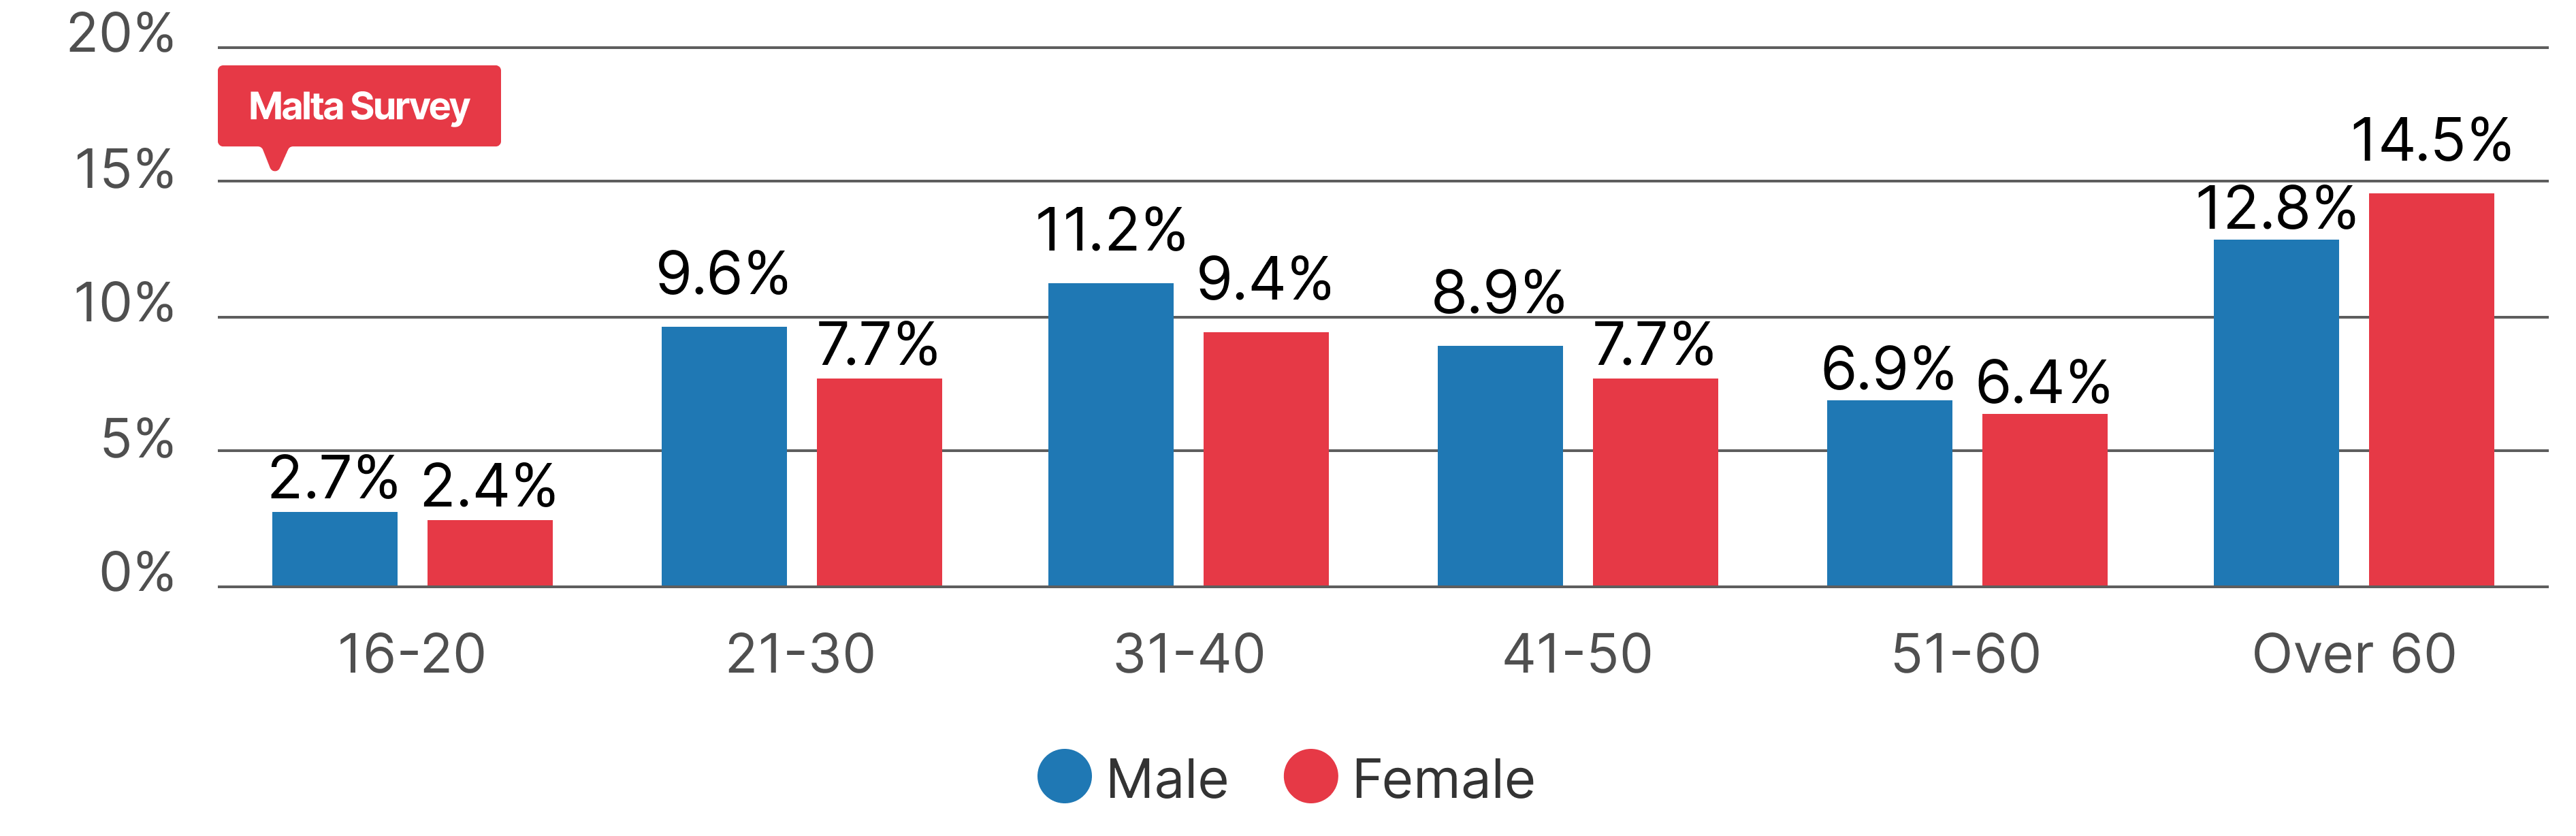
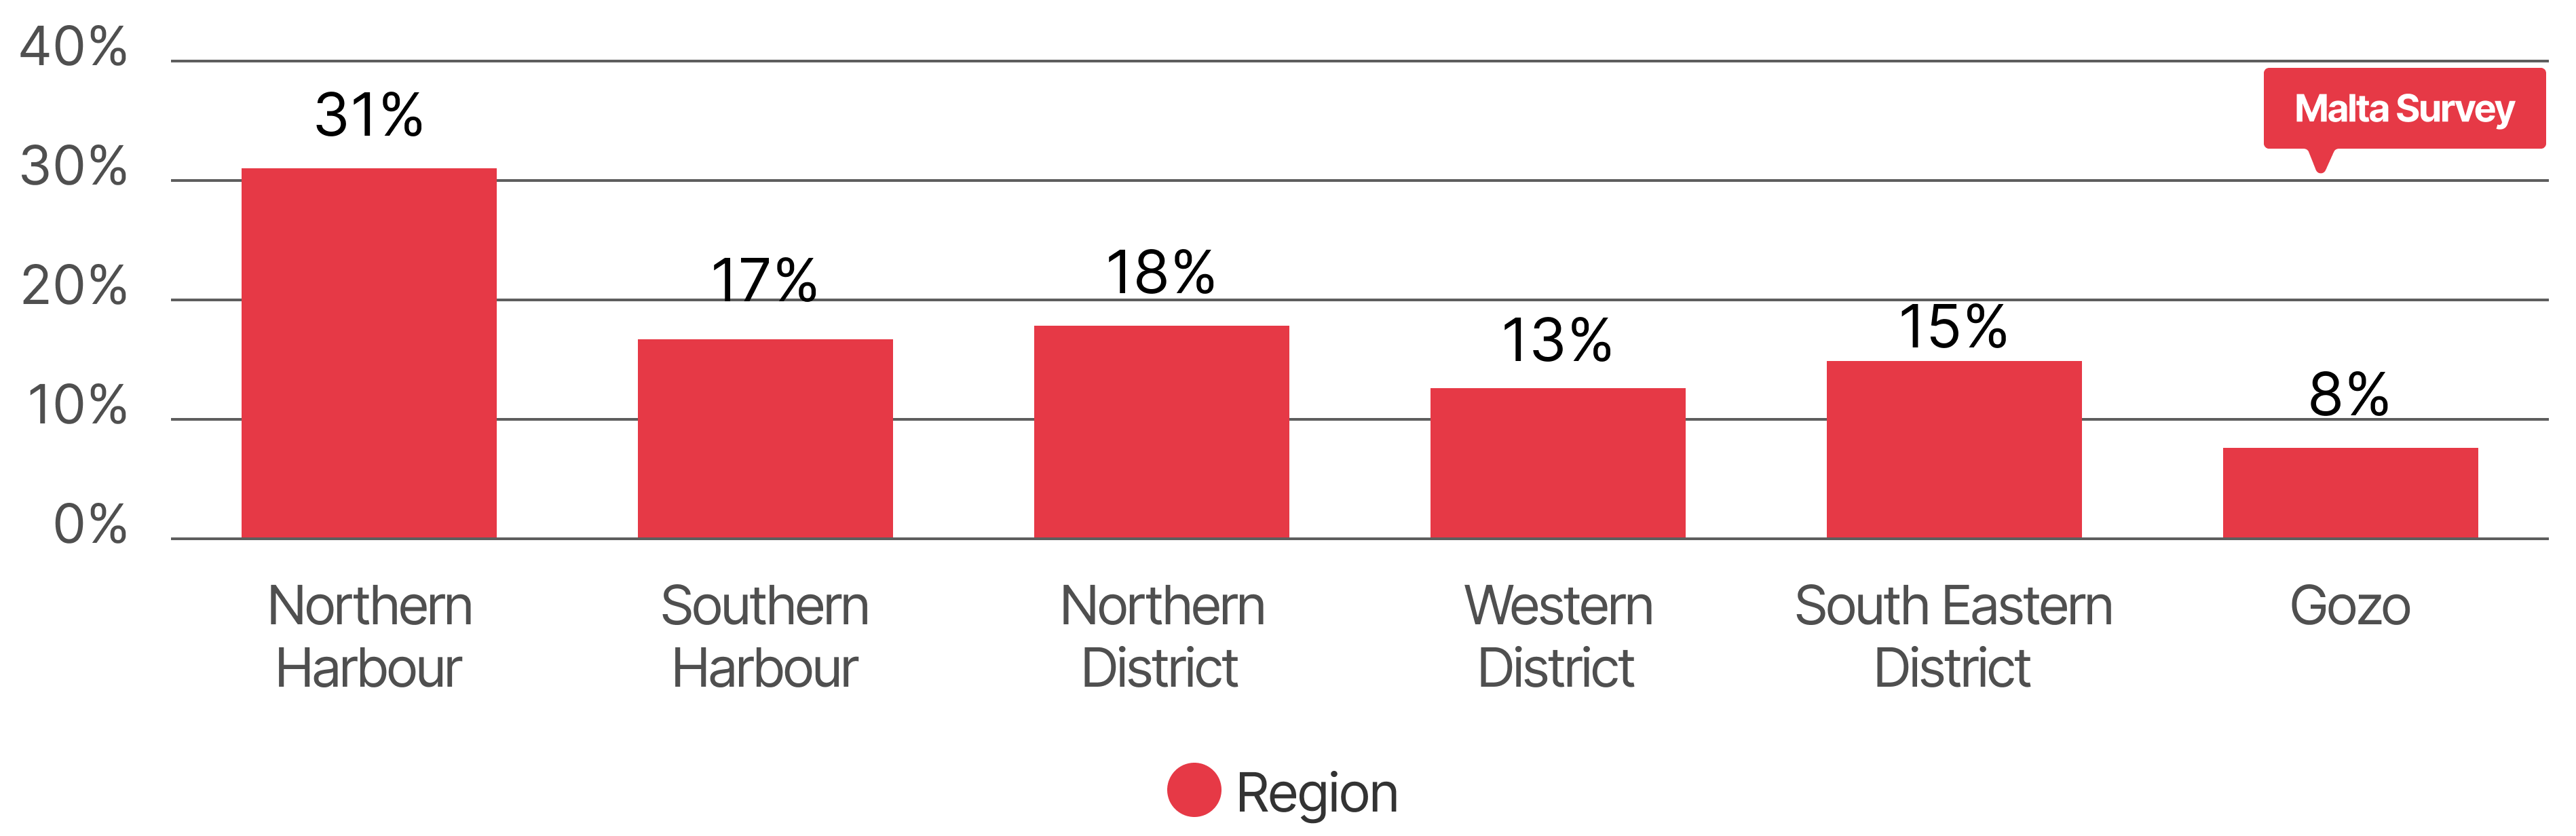
The sample includes 1,004 participants, with 52% males and 48% females, distributed across different age groups. The regional distribution indicates that the sample is representative of the population of the Maltese islands.
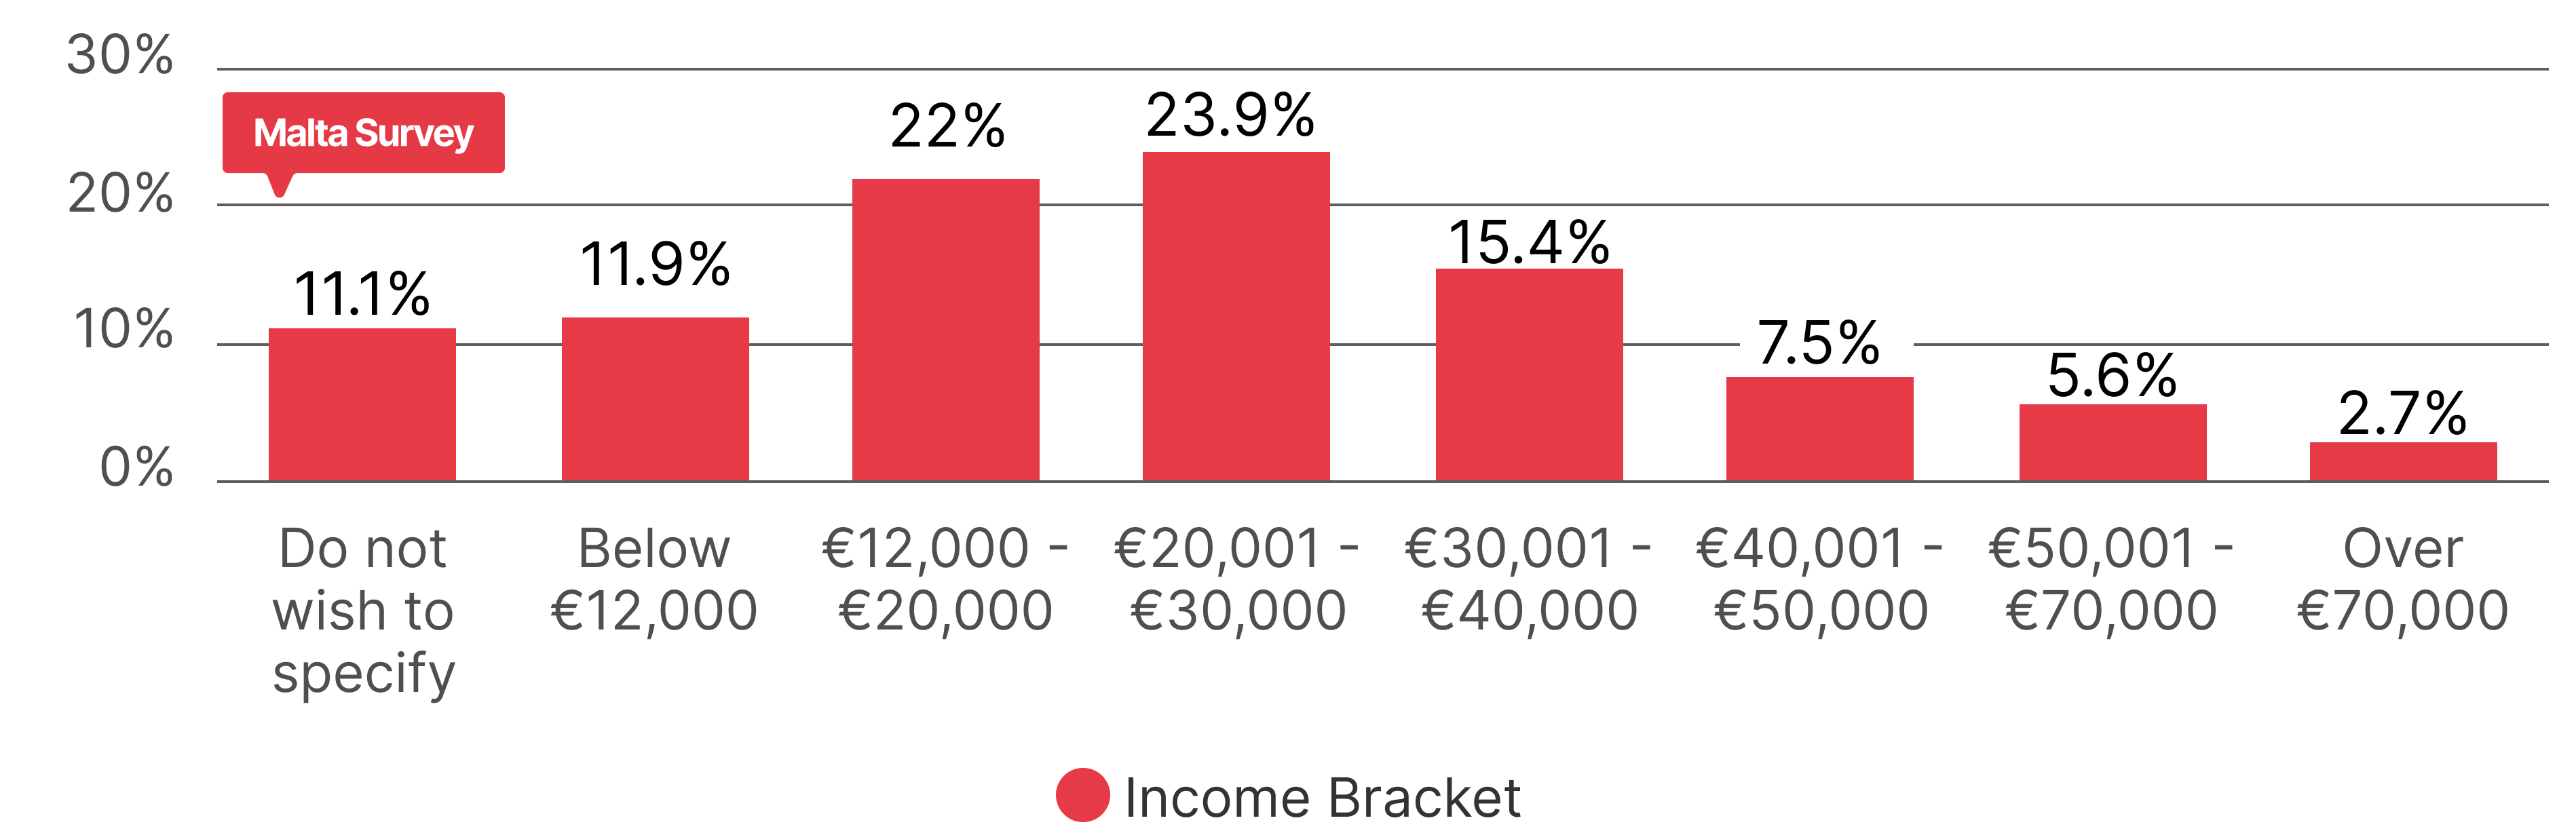
The income distribution of this sample peaks within a range of €20,000 to €30,000 annual income. Notably,11.1% of participants chose not to disclose their income bracket, indicating a possible unverified shift in income distribution.
Important measures expected from Budget 2026
This question asked participants to select and rank their top three measures they want to see in Budget 2026. The options presented covered a range of economic and social measures, largely related to cost-of-living and financial support. These included controlling prices of essential goods, adjusting income policies and fiscal reforms, among others (see Table 1 for the full list of measures).
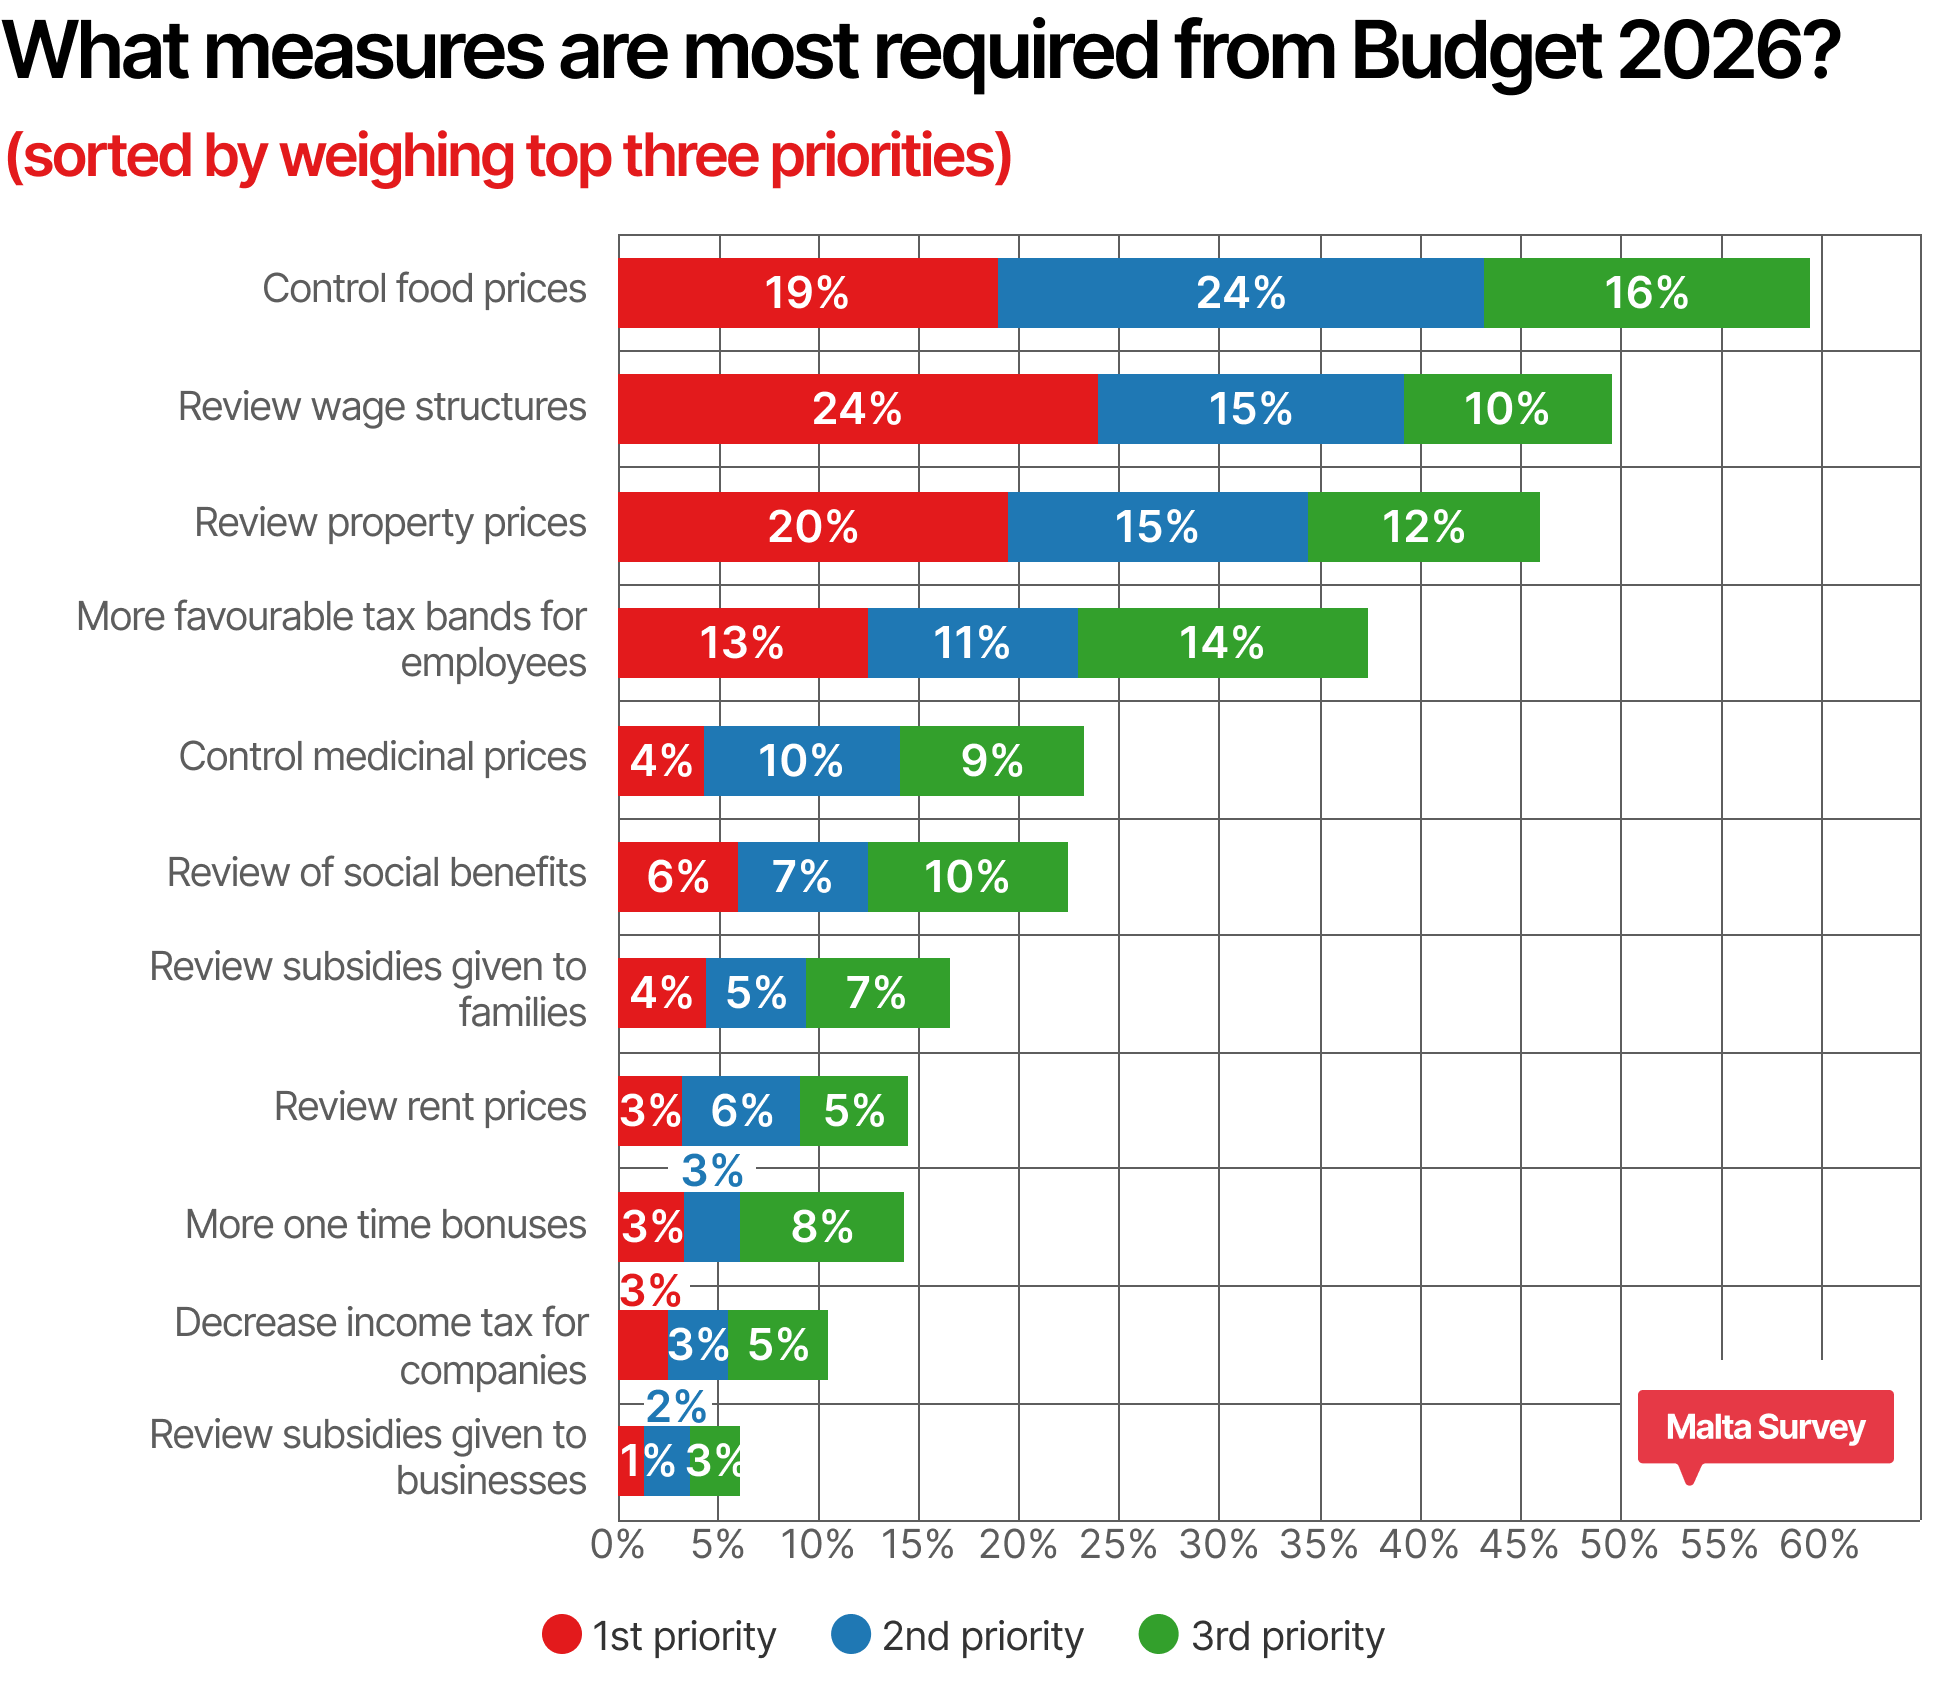

In terms of first-choice priorities, the most frequently chosen item was a review of wage structure (selected by about 24% of respondents as their number one priority). This was closely followed by controlling food prices, which 19% of respondents chose as their top priority, and reviewing property prices at 19.5% for first priority. These top three first-preference choices indicate that many people are focused on measures to improve their standard of living – namely, ensuring fair wages, stabilising the cost of basic necessities, and tackling housing affordability. Another notable first-preference choice was introducing more favourable tax bands for employees (about 12.5% chose this first), underscoring a desire for tax relief on personal income. Each of the remaining measures (such as lowering medicinal prices, adjusting social benefits, subsidies, rent, etc.) was the very top priority for a smaller fraction of the sample (generally under 6% each in first-place submission), suggesting that they are important to specific groups but not the foremost concern for the majority.
However, when we incorporate second and third preferences through the weighted scoring system, a clearer overall picture of public priorities emerges. In this weighted tally, controlling food prices rises to the top as the highest priority overall, even though it was second to wage reviews in first-place votes. This is because “controlling food prices” had not only strong first-choice support, but also the highest share of second-place selections (24.2% of respondents ranked it as their second priority) and a significant share of third-place mentions (16.3%).
Reviewing wage structures remains a very close second in the overall ranking; it received the most first-choices, but a bit less support in lower ranks compared to food prices. Reviewing property prices emerges as the third overall priority once all rankings are accounted for, bolstered by steady second (14.9%) and third (11.6%) preference selections across the sample. In fourth place overall is adjusting tax bands for employees, which, despite a moderate first-choice showing, gained additional support as a second or third priority (it was the third-choice of 14.4% of respondents, for example). This weighted approach thus confirms that cost-of-living issues dominate the public’s agenda, with food costs, wages and housing costs forming the core “must-address” list for Budget 2026.
On a practical level, the public appears to prioritise measures that increase disposable income or reduce essential expenditure, for instance, wage increases, cheaper staple goods and tax relief all directly contribute to more money in people’s pockets. By contrast, the lower-ranked items tend to be those whose benefits are less directly felt by households. For instance, decreasing income tax for companies and reviewing subsidies for businesses were the least frequently chosen priorities (together drawing only around 3-5% in first preferences and very little overall support), signalling that pro-business incentives are currently seen as far less urgent than measures that address household financial pressures. Even one-time bonuses or temporary handouts ranked low (near the bottom of the list), suggesting that respondents prefer sustainable, long-term solutions over short-term fixes. Overall, the public’s message for Budget 2026 is clear: focus on containing the cost of living and boosting incomes, as these are the areas of greatest concern.
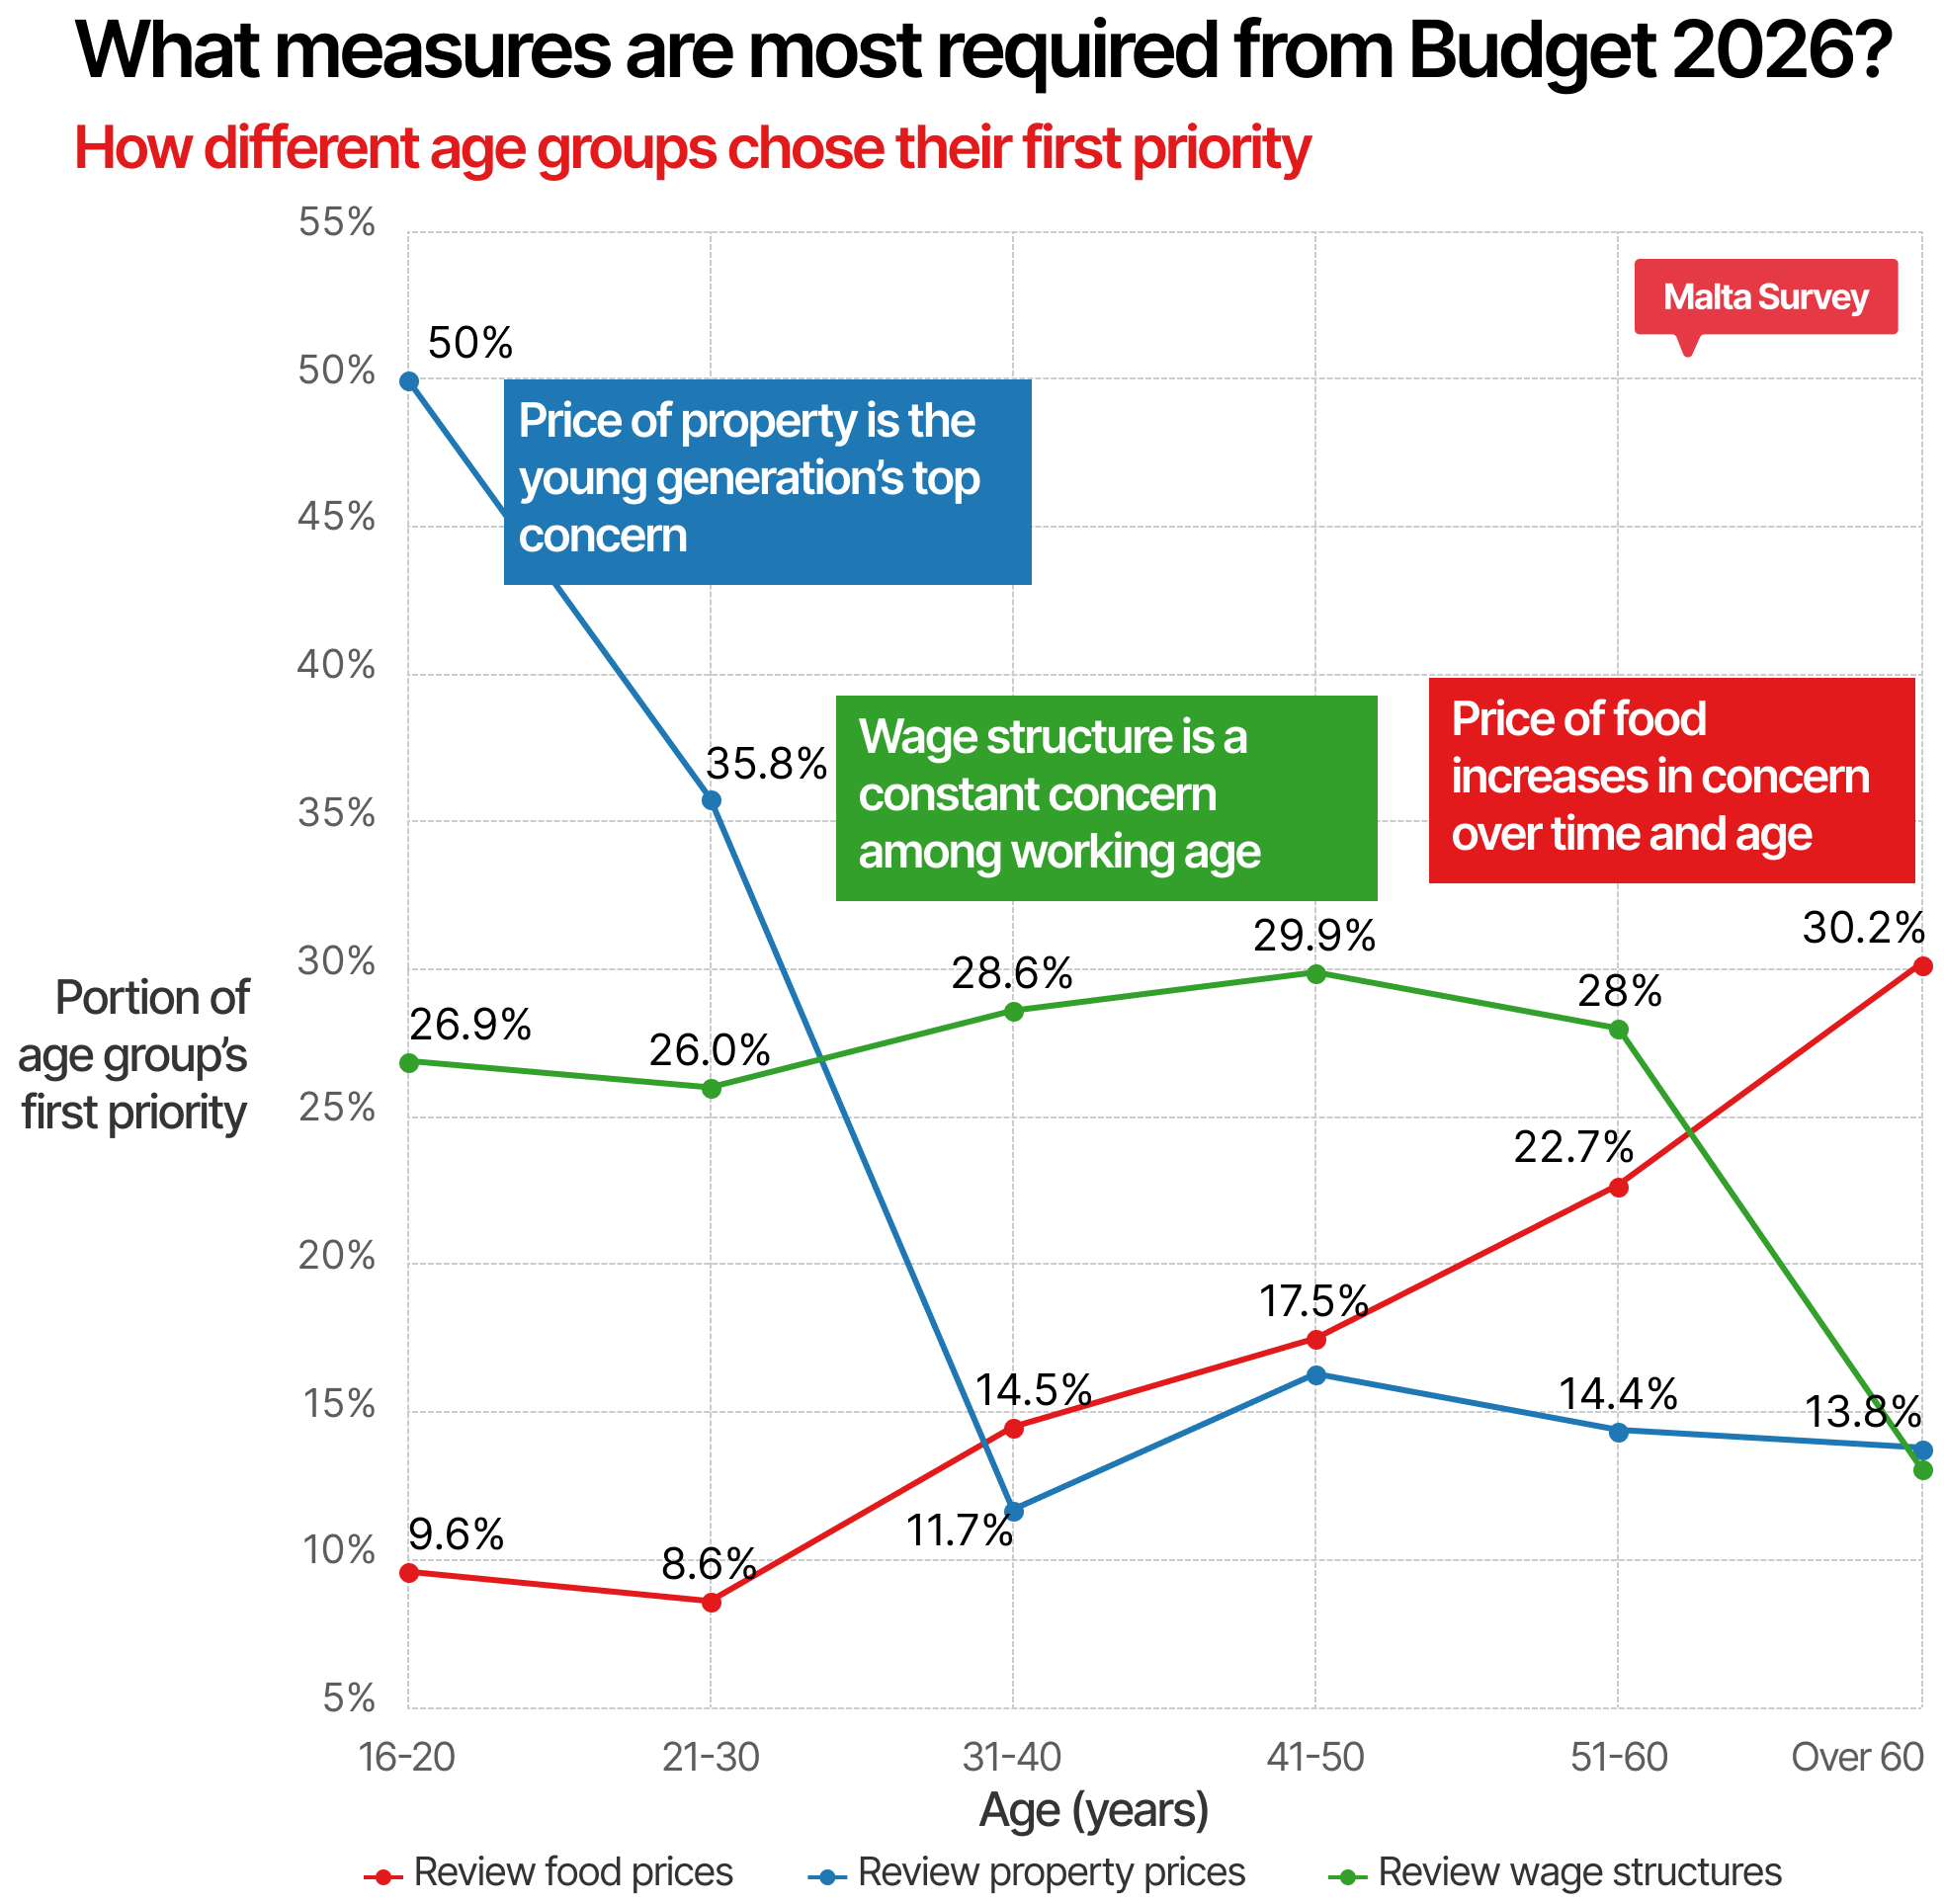
Looking at first-priority choices by age, three clear patterns emerge. Housing affordability is an overwhelming issue among the youth, where 50% of 16-20 year olds and 35.8% of 21-30 year olds put reviewing property prices first, with that concern dropping sharply from the 30s onward as a first priority solely. A review of wage structures is the backbone concern of working-age adults, featuring as a top first choice across the core labour-force years. Food prices become more pressing with age: the share choosing “review food prices” rises steadily from 9.6% (16-20) to 22.7% (51-60) and peaks at 30.2% among those over 60 years of age, pointing to tighter fixed-income budgets and day-to-day affordability concerns later in life. In short, younger cohorts prioritise getting onto or staying on the housing ladder, mid-career adults push for wage reform, and older Maltese prioritise relief on essential living costs, especially food.
Supported suggestions to control the current government deficit
This question aimed to identify which deficit-reduction strategies the public favours most. Respondents again ranked their top three choices among several options focused primarily on cutting or optimising government expenditures. The five measures presented were:
- Controlling spending by government agencies and authorities
- Stricter means-testing for social benefits
- Rationalising assistance given to businesses
- Reducing spending on national projects, and
- Gradually reducing the number of public-sector employees
All these choices reflect different ways to curb government outlays in order to shrink the fiscal deficit.
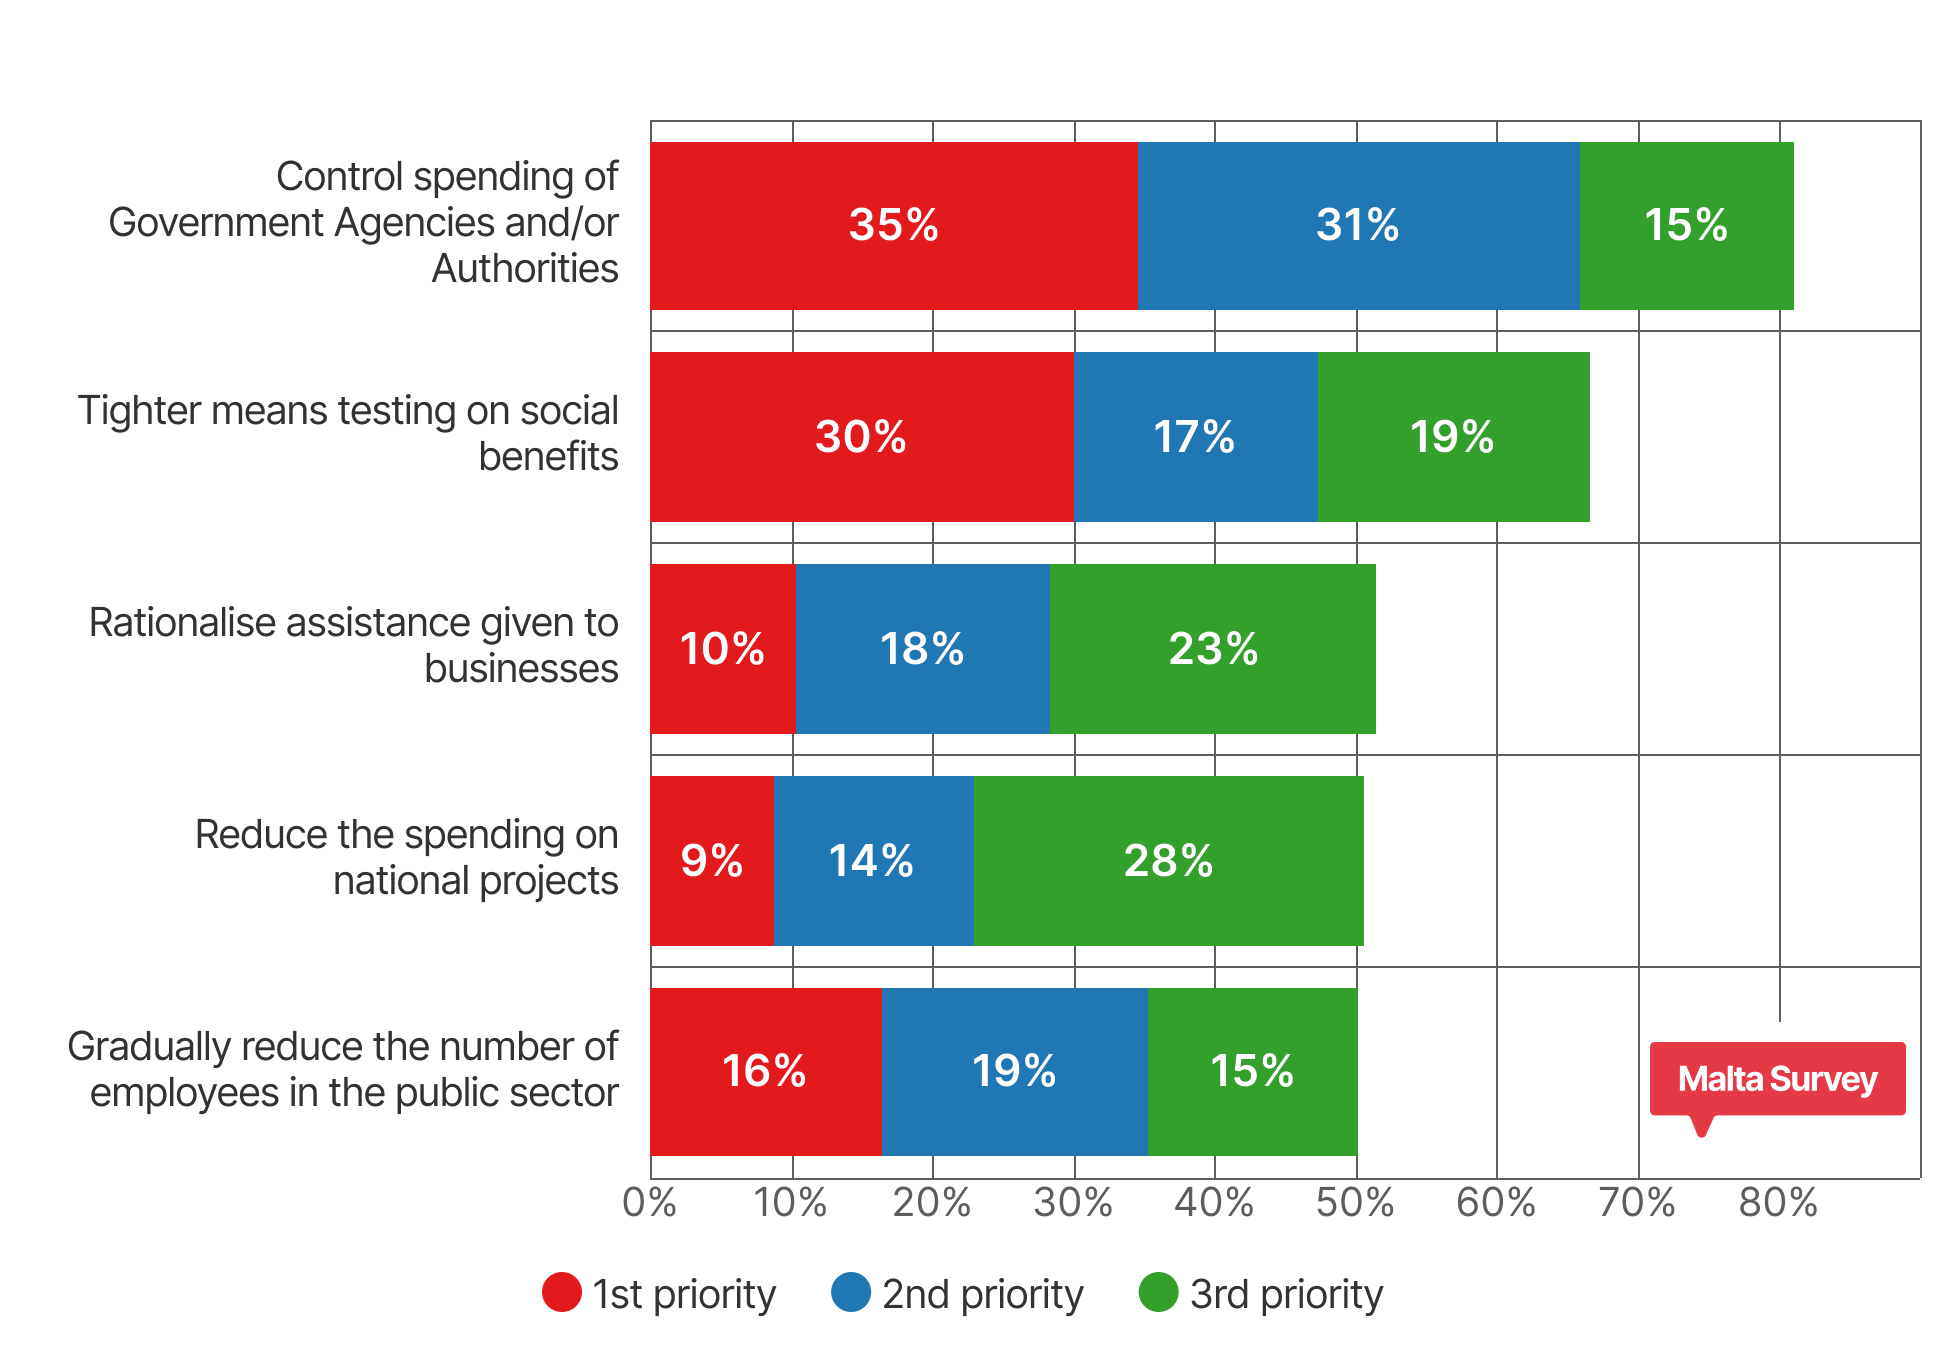

The survey results reveal a strong consensus on the primary measure: “control spending of Government agencies and authorities”. This was by far the top-ranked deficit measure. Over one-third of respondents (34.6%) chose this as their first priority, and it also attracted the highest second-place ranking (31.3%) among the options. This suggests that the public widely perceives that many government agencies, authorities, or departments have excess or inefficient spending that could be trimmed. In other words, people believe that better efficiency and accountability in government operations can save money – a sentiment implying that public agencies should become more efficient before the government considers other fixes. As one might expect, this measure’s combined weighted score easily outstripped the others, cementing it as the number one recommendation to reduce the deficit. It aligns with a recurring public sentiment from previous years that the government should curb its own expenditures first and foremost.
The second most popular deficit-reduction measure was to implement tighter means-testing on social benefit programmes. About 30.1% of respondents made this their first-choice solution for the deficit, and many others ranked it second (17.3%) or third (19.2%). This sizeable support reflects a concern that while Malta’s social welfare system is important, there may be inefficiencies or even abuses in allocating benefits. It is important to note that this suggestion is not about cutting the social services themselves, but rather about improving the eligibility screening for benefits. The fact that a large segment of people prioritise stricter means-testing indicates a desire to safeguard welfare programmes by making them more efficient, thus reducing unnecessary expenditure while continuing to protect the vulnerable.
Beyond the top two, there was relatively less consensus. The third-ranked suggestion overall was to “rationalise assistance given to businesses”. This measure had a lower first-choice selection (only about 10.3% picked it as their top priority). However, it appeared frequently as a second or third choice (18% and 23.2% of respondents, respectively included it in their rankings (which indicates a broad base of moderate support). The public may feel that, similar to welfare programmes, corporate assistance should be better targeted or reduced to save public funds, especially if some programmes are seen as handouts to companies that could manage without government help.
Close behind in the overall scoring was reducing spending on national projects, which came out as the fourth-ranked deficit measure. Only 8.8% of respondents gave this their first priority, but significantly more included it as a third priority (27.6%, the highest third-place percentage among the options). This implies that while relatively few people would slash big projects before other actions, a good number see it as an acceptable measure if additional deficit reduction is needed. National projects (such as large infrastructure developments, capital expenditures on public works, etc.) often involve substantial budgets. The public’s willingness to list this option suggests some believe these projects could be scaled back or delayed as a way to improve the fiscal balance.
The final option, to gradually reduce the number of employees in the public sector, ranked fifth (last) among the deficit measures according to the weighted results. Interestingly, this measure did have a notable minority who felt strongly about it (16.4% chose it as their first priority, which is higher than the first-choice percentage for some options ranked above it). However, comparatively fewer respondents assigned it as a second or third priority, so its overall weighted score fell below the others. In previous editions of the survey, reducing public sector headcount features more prominently (it was the third-ranked suggestion last year), so its drop to the bottom in this year’s ranking could indicate either a slight shift in public priority or simply that the competition from other measures is stronger.
Priority economic sectors for Budget 2026
In the third question, respondents identified which sectors of the economy they believe should receive the most attention and resources in Budget 2026. They were asked to rank their top three sectors from a list of ten broad sectors. The sectors considered were Health, Environment, Education, Infrastructure, Social Services, Security, Employment, Energy, Research & Development and Tourism.
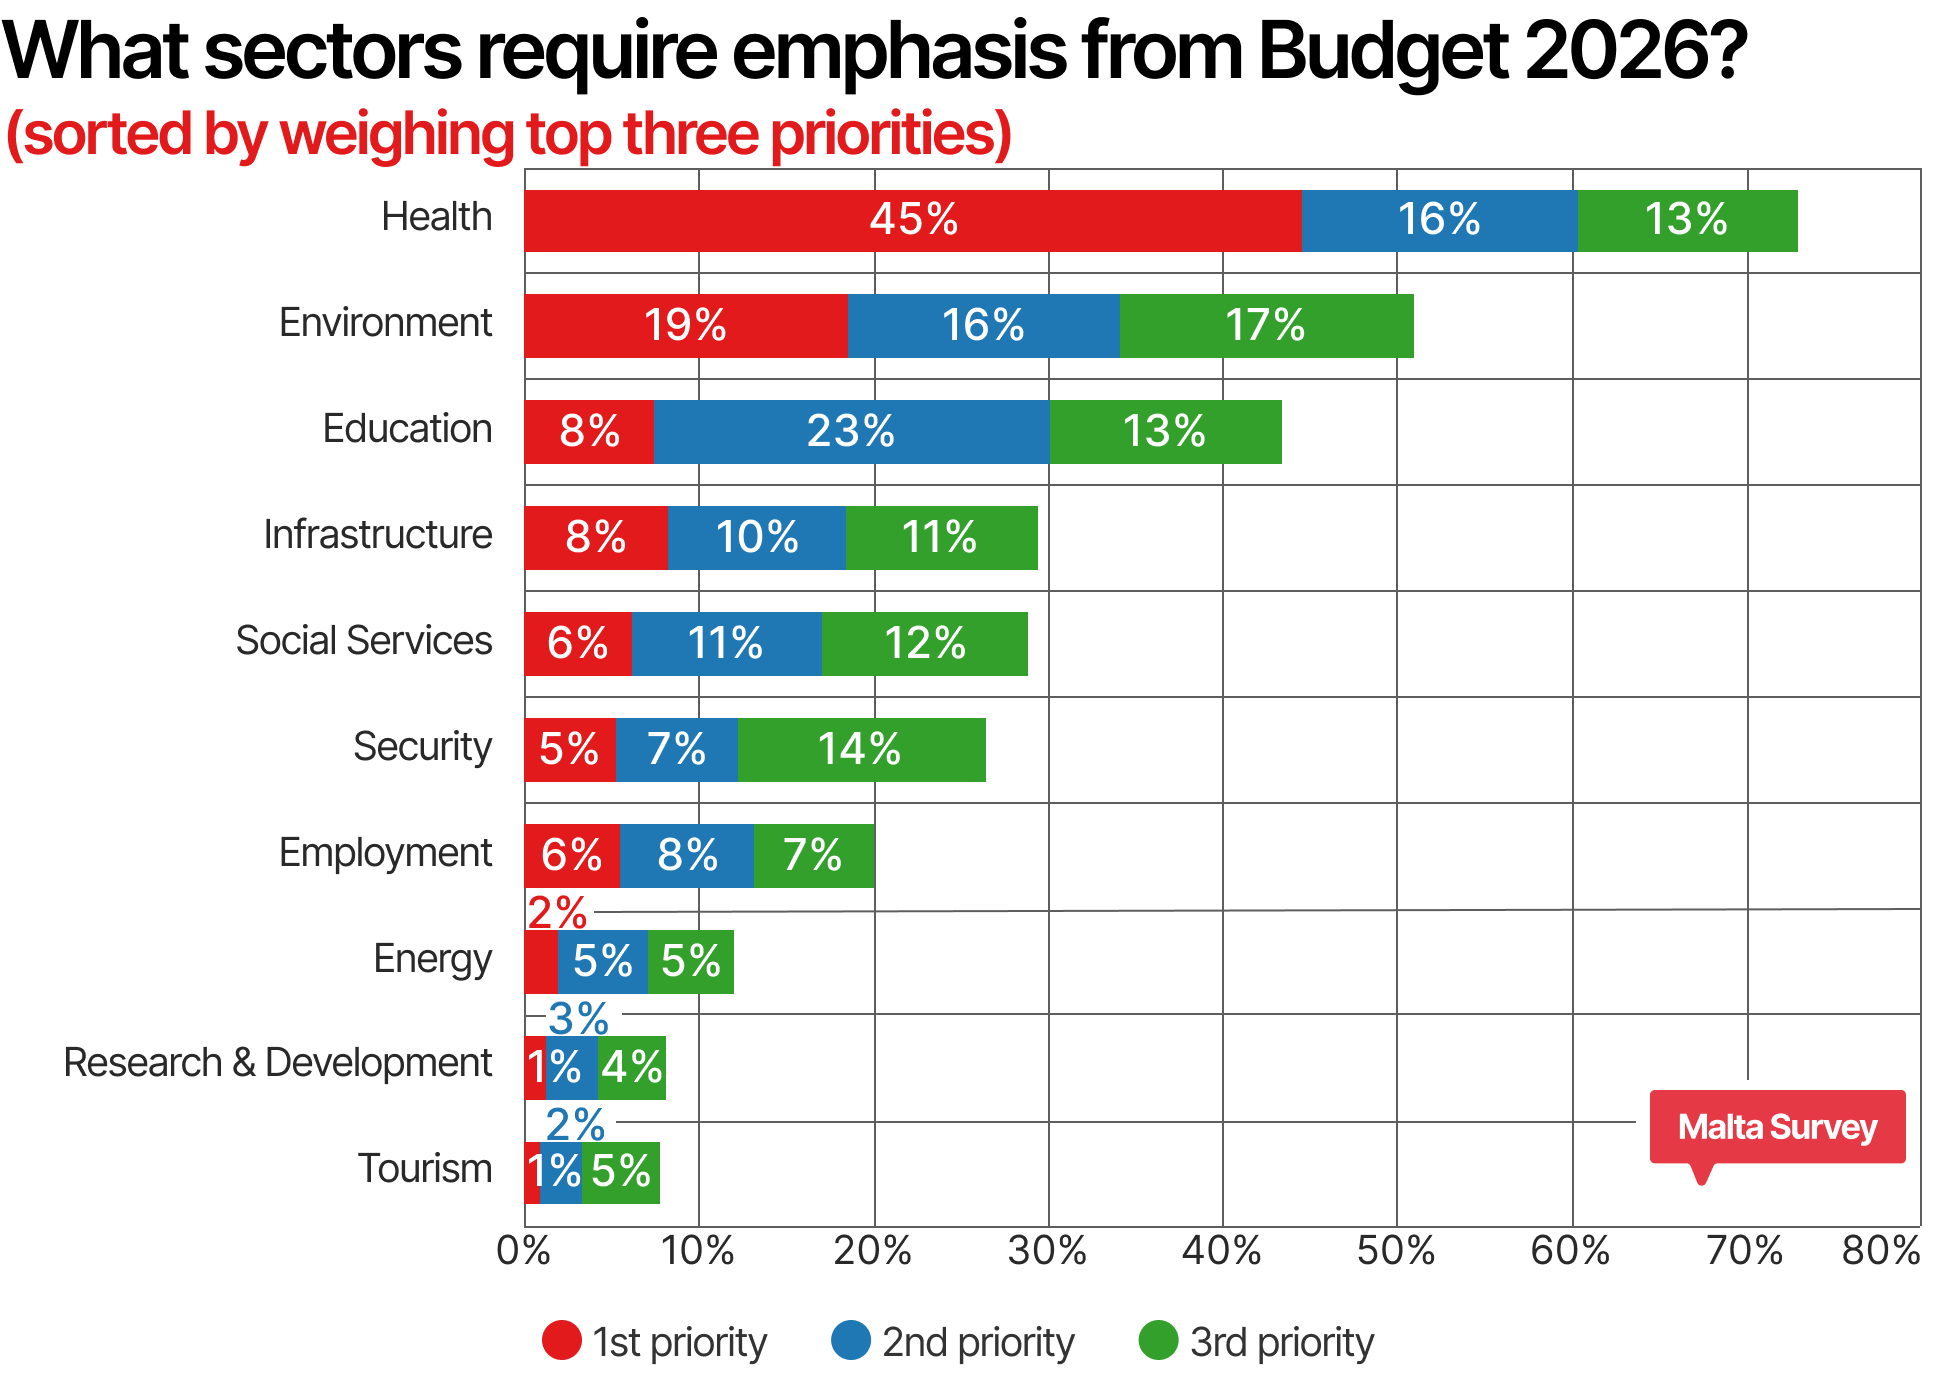

The results show how three clear sectors stand out from the rest – mirroring a pattern observed in prior years. Health is unequivocally the highest priority sector, according to the public. In fact, an impressive 44.6% of the respondents chose the Health sector as their number one priority for government spending in the upcoming budget. Health also attracted a substantial share of second (15.8%) and third (12.6%) place votes, giving it by far the largest overall weighted score among all sectors. This level of support suggests that Maltese people place utmost importance on healthcare – likely expecting the government to invest in improving medical services, facilities, staffing and health outcomes. Health has consistently topped the list each year that MaltaSurvey.com has run this poll, and it continues to be seen as the most critical area for public investment. Given the experiences of recent years (including public health challenges and an ageing population), it’s unsurprising that nearly half the population believes health should be the government’s first priority year on year.
Environment emerges as the second-highest priority sector in the survey. About 18.6% of respondents gave Environment their first-place vote, and it also received a healthy portion of second (15.5%) and third (16.9%) ranks. This indicates that environmental concerns have a strong resonance with the public – not at the level of healthcare, but firmly in the top tier. Over the past few years, the importance accorded to the environment has been rising steadily, reflecting growing awareness of environmental issues in Malta. The environment’s high ranking (2nd overall) suggests that Maltese society broadly recognises that a better quality of life is linked to a better environment.
Education is the third key sector that the public wants prioritised. Interestingly, only 7.5% of respondents marked Education as their top choice. However, education garnered a substantial share of second-place votes, 22.6% (the highest second-choice percentage of any sector) and a solid 13.3% third-place share. This posits that while Education might not always be people’s number one issue, it is very commonly seen as the next-most important area. When the weighted scores are tallied, Education firmly secures the third rank overall. This could imply that respondents feel the education system needs investment and reform, but perhaps they see healthcare and environmental issues as more immediate concerns. It is also possible that some respondents assumed education is given a priority and thus chose to highlight other areas first. Nonetheless, the high combined ranking shows a broad consensus that education remains a pillar for Malta’s long-term development and warrants substantial budget attention. Notably, Health, Environment and Education have consistently been the top three sectors in all the recent pre-budget surveys (with some variation in their order), underscoring their enduring importance in the public’s eyes.
Beyond the top three, there is a significant drop-off in priority weight. Infrastructure came in fourth place in the rankings. Around 8.3% chose infrastructure as their first priority, and it received modest support in second/third rankings (for an overall 9-10% of weighted points). Social Services is close behind infrastructure in fifth place, with 6.2% first-choice support and a similar overall share of points (around 9%). Security and Employment were next, but notably, each of these sectors garnered only around 5% or fewer first-place votes. Their combined first, second and third preference shares were also relatively low.
The lowest-ranked sectors for budget prioritisation amongst the sample were Energy, Research & Development and Tourism, which is identical to the pattern seen in the previous year’s survey. Very few respondents picked these as top priorities.
In summary, the sample’s message is that Budget 2026 should, above all, concentrate on healthcare, followed by the environment and education. These sectors are seen as fundamental to citizens’ well-being and the country’s future. After those, maintaining and improving infrastructure and social services are secondary but still notable priorities.
Budget 2026 Expectations Sentiment
After examining policy priorities, the survey turned to gauging public confidence: essentially, how optimistic or pessimistic people are that the Budget 2026 will actually address the needs and priorities identified. Respondents were asked to rate their confidence on a five-point scale: Highly Confident, Somewhat Confident, Not Sure, Not that Confident or Not at all Confident.
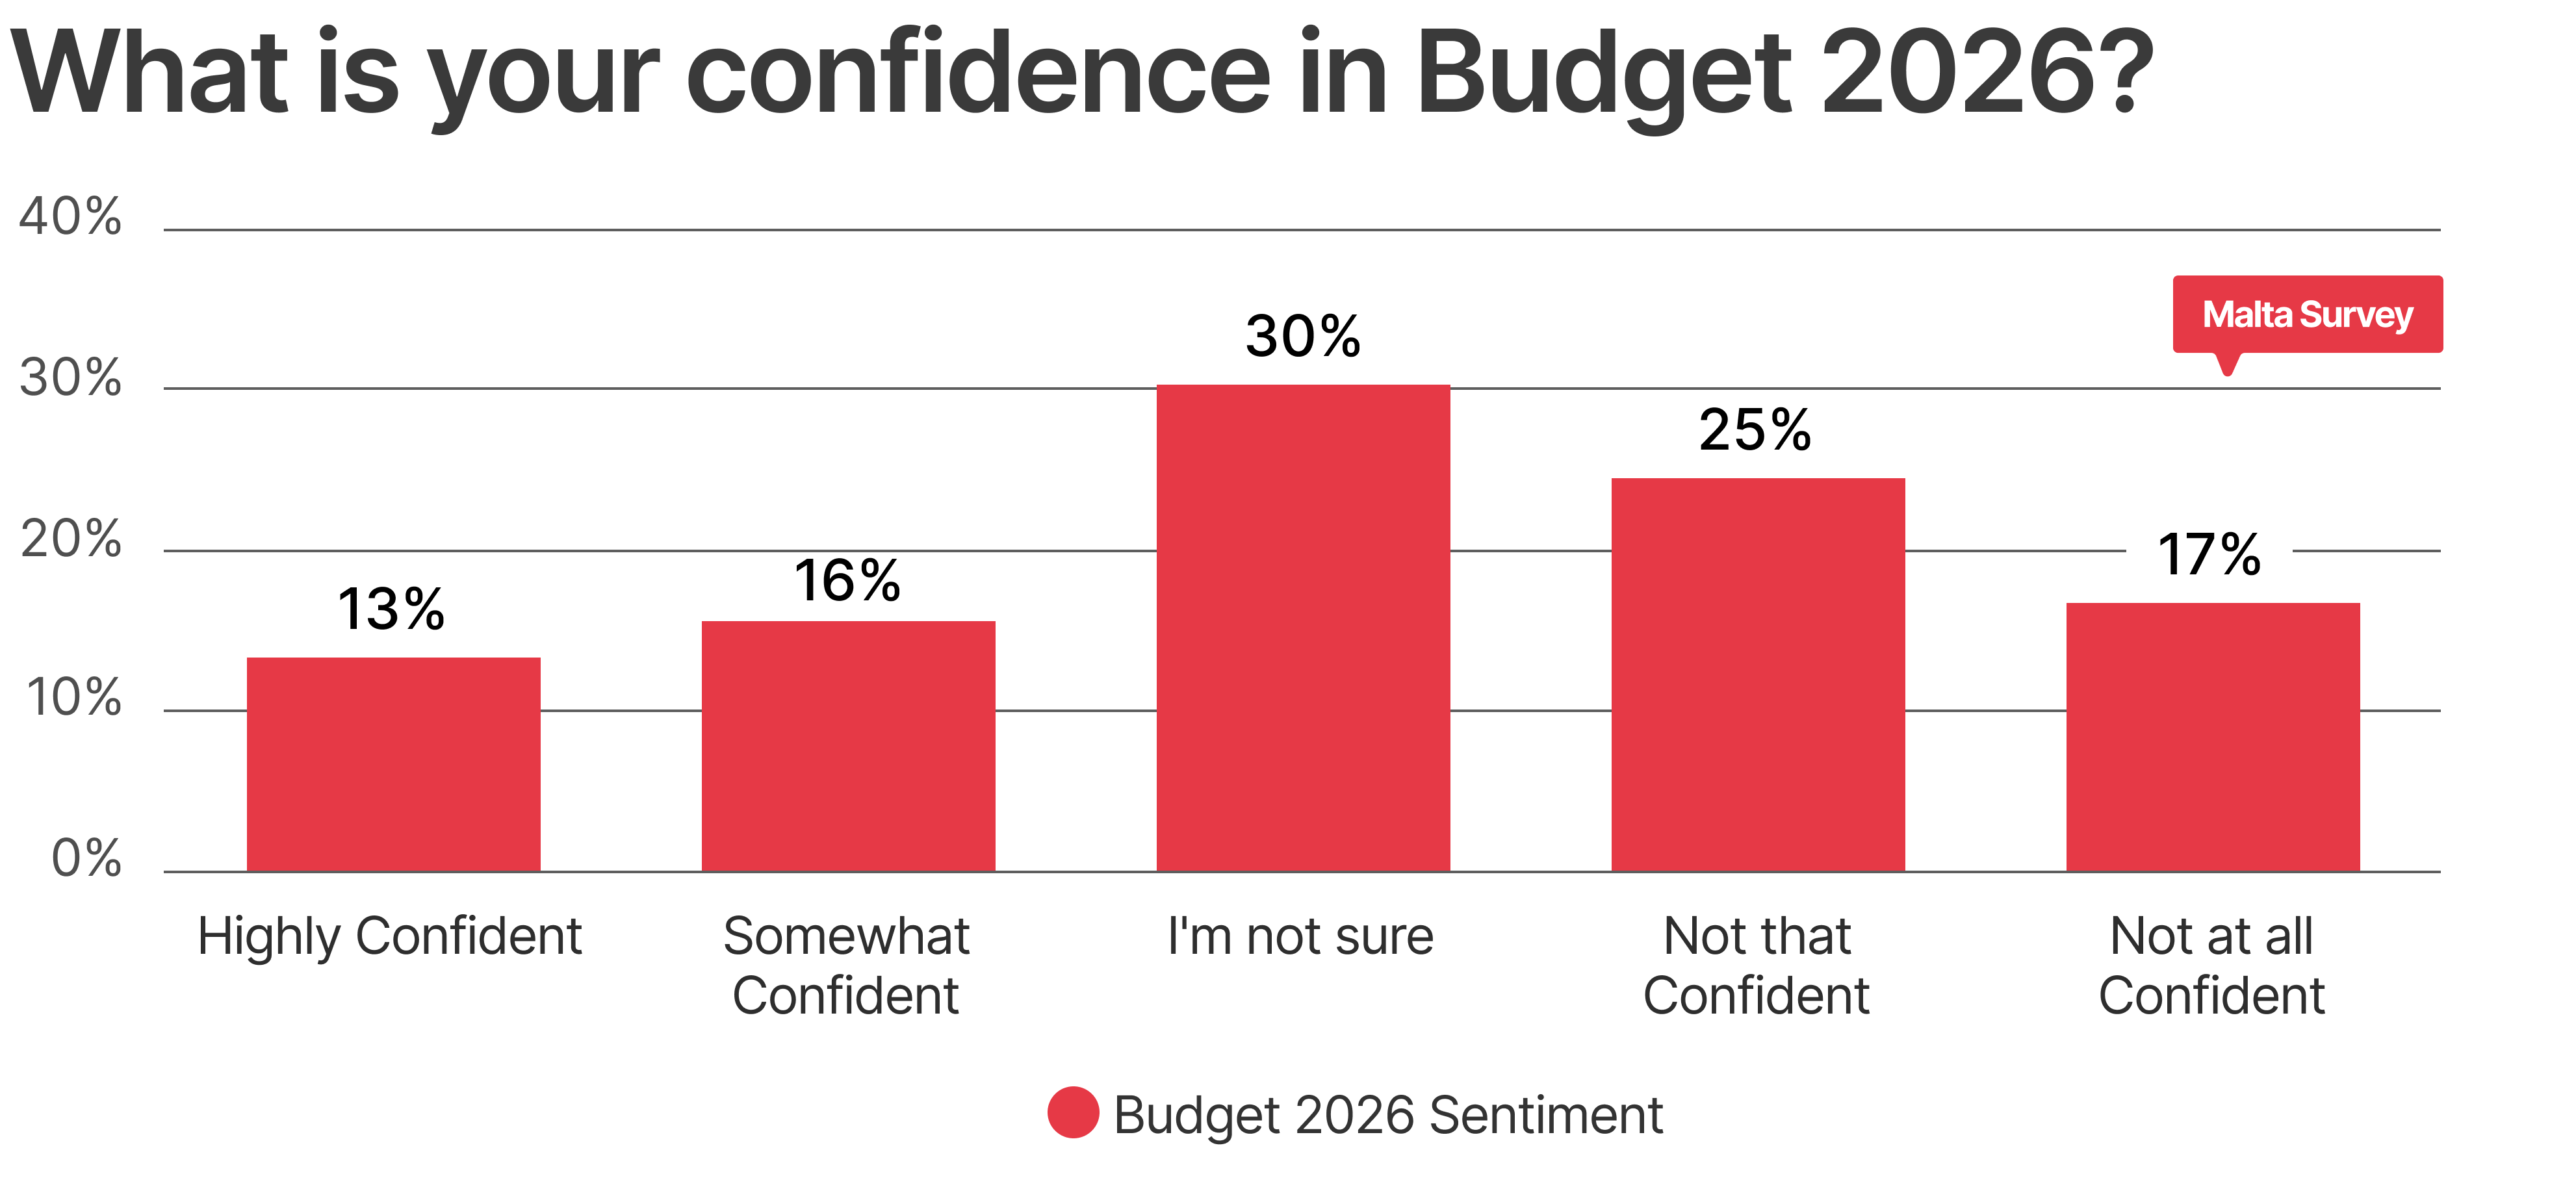
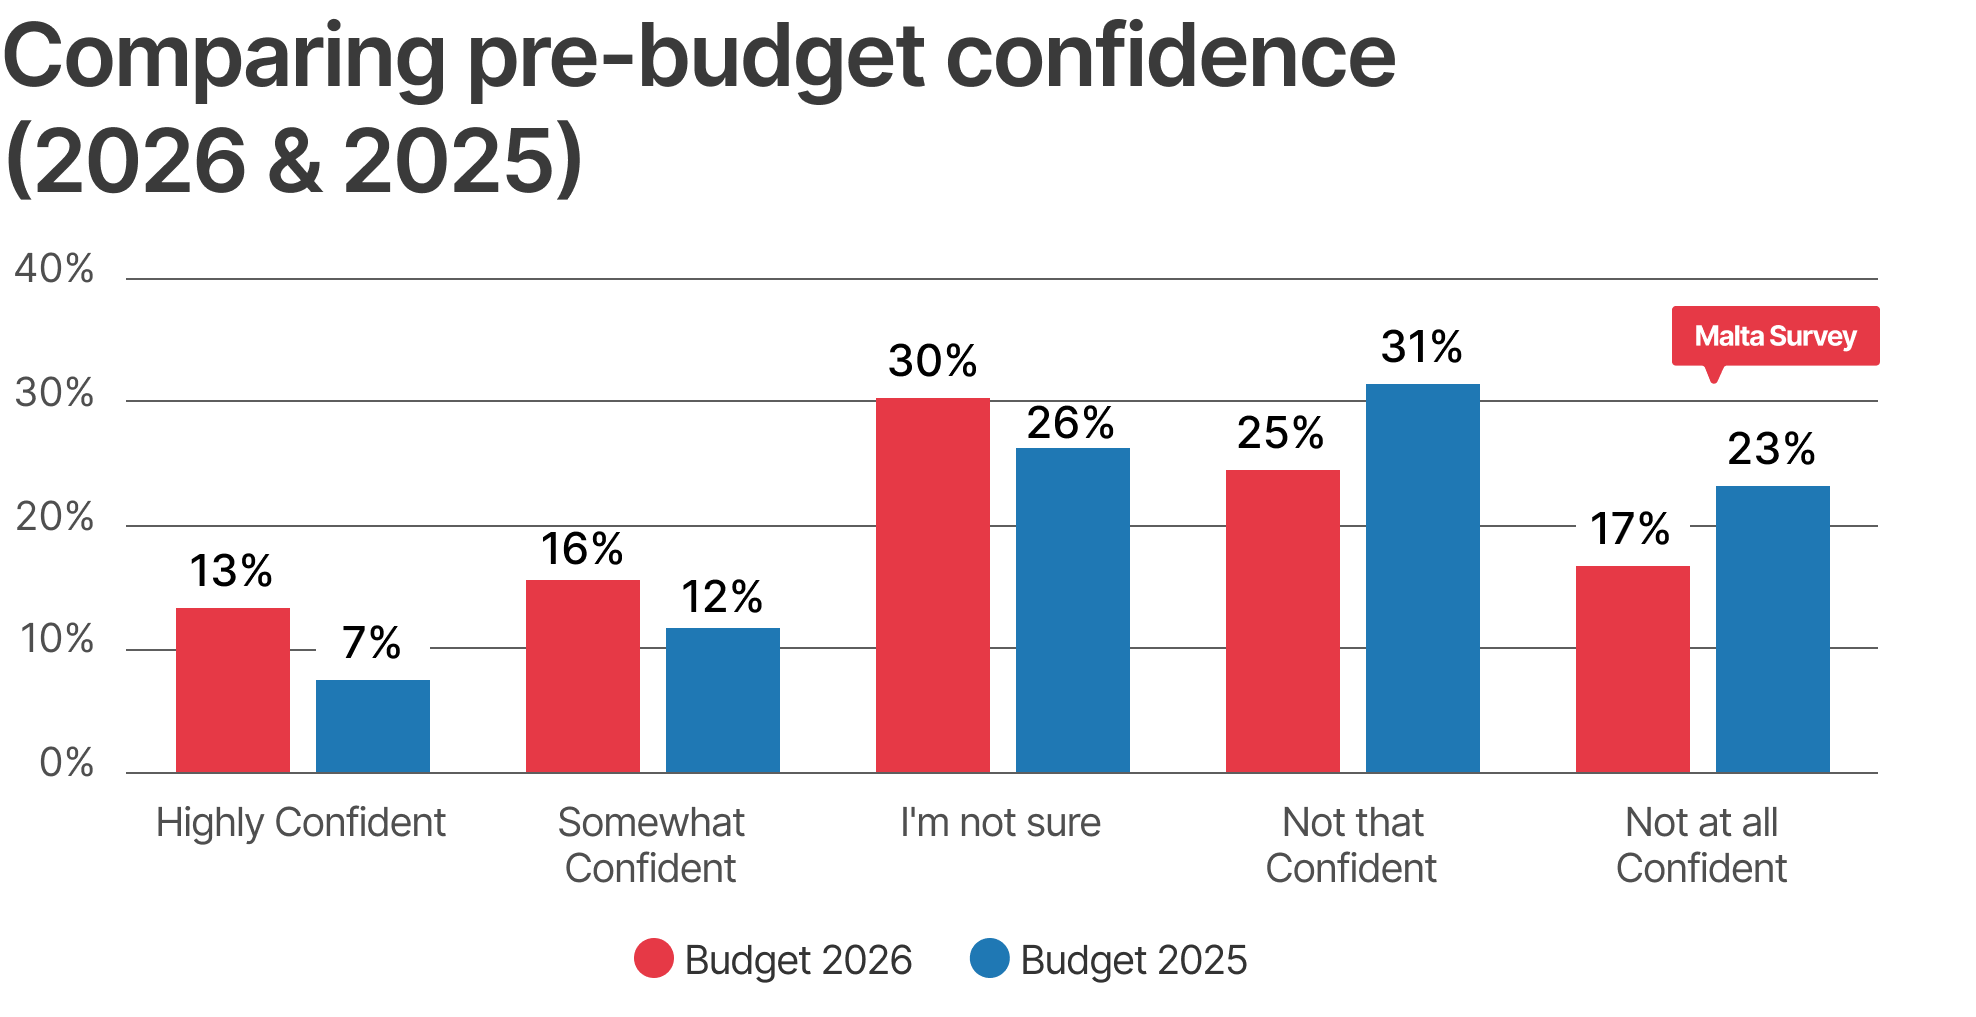
The results reveal a public that is cautiously uncertain at best and sceptical at worst about Budget 2026 meeting their expectations. The most common response was the ambivalent “I’m not sure”, chosen by 30.3% of respondents in the sample. In other words, nearly a third of the respondents neither have confidence nor lack it – they simply aren’t sure what to expect.
Meanwhile, the remainder of the respondents skew slightly more towards pessimism than optimism. A total of about 41% express a lack of confidence to some degree (24.5% answered “Not that confident” and an additional 16.6% as “Not at all confident”).
It is informative to compare these sentiments with those from last year’s pre-budget survey. Confidence levels have improved somewhat compared to the run-up to Budget 2025. The percentage of respondents who are highly confident in Budget 2026 (13.2%) appears almost double that of those who were highly confident before Budget 2025 (7.4%). Similarly, “Somewhat confident” rose to 15.5% from 11.7% the year prior. Moreover, the most negative category, “Not at all confident”, decreased to 16.6% from 23.1% last year. These shifts suggest a mild uptick in public faith. However, it is not a solely positive trend as uncertainty also grew (30.3% this year from 26.3% last year), while the mild scepticism (“Not that confident”) decreased, indicating some people move from mildly doubting to either being unsure or slightly more optimistic.
References
Alwin, D. F., & Krosnick, J. A. (1985). The measurement of values in surveys: A comparison of ratings and rankings. Public Opinion Quarterly, 49(4), 535-552.
Orme, B. K. (2009). Which conjoint method should I use? Sawtooth Software Research Paper Series.
Saaty, T. L. (1977). A scaling method for priorities in hierarchical structures. Journal of Mathematical Psychology, 15(3), 234-281.