
Malta Budget 2027 Expectations

Article byIDEA Consulting Research TeamPublished on Thu Oct 22 202634 minute read
Executive Summary
Between 5th and 19th October 2026, MaltaSurvey conducted its annual nationwide online poll to gauge public expectations ahead of Budget 2027, which is due to be presented to Parliament on 26th October 2026. This is the fifth year the survey has been run with the same questions, allowing like-for-like comparisons with previous editions.
The poll closed with 913 complete & valid responses, drawn through demographically targeted advertising and weighted to the population by gender, age and region. A random sample of this size would carry a margin of error of ±3.24% at the 95% confidence level; allowing for the weighting, the effective precision is about ±3.6%.
Entries underwent automated validation to prevent duplicates; questions were neutral and available in Maltese or English. For ranking questions, results were weighted 3-2-1 (1st/2nd/3rd choice) to reflect both the intensity and breadth of support. Throughout this report, this year’s results are compared with those from the Budget 2026 and Budget 2025 surveys, providing a three-year window.
The headline findings are as follows:
- Housing overtakes food and wages. For the first time since the survey began, reviewing property prices is the public’s top-ranked measure, ahead of controlling food prices and reviewing wage structures. Its first-choice share has risen in each of the last three surveys, from 12.8% (Budget 2025) to 19.5% (Budget 2026) to 24.3% this year. Rent prices have also gained ground. Housing affordability is now the fastest-growing concern in the survey.
- Confidence has fallen back to Budget 2025 levels. Only 20.6% of respondents are confident that Budget 2027 will meet their expectations (9% highly confident, 11.6% somewhat confident), down from 28.7% last year. The share that is not confident has risen from 41.1% to 53.4%, and the most negative response, not at all confident, has grown from 16.6% to 25.4%. The improvement recorded before Budget 2026 has been reversed.
- Younger Maltese are the least convinced. Scepticism is heaviest among the under-40s. Not a single respondent aged 16-20 said they were highly confident, and 62.7% of those aged 21-30 and 58% of those aged 31-40 are not confident.
- Age shapes the detail. The familiar life-stage pattern (property for the young, wages for the working-age, food for the over-60s) still holds, but property concern has spread into the 30s and 60s. Tax bands matter most to 51-60-year-olds, a review of social benefits is almost exclusively an over-60 demand, and on the deficit the working-age favour tighter means-testing while the youngest and oldest want Government to cut its own agencies’ spending first.
- Environment slips, Energy climbs. Health remains the top sector by a wide margin (42.8% first choice). Education has moved up to second place, and Environment has slipped to third, with its first-choice share falling from 18.6% to 11%. Energy is the notable riser, moving from eighth to fifth place, with a weighted score two and a half times last year’s.
- Deficit reduction: cut Government’s own spending first. The public continues to ask Government to control the spending of its own agencies and authorities first (35.8% first choice), with tighter means-testing of social benefits second. Support for gradually reducing public-sector headcount has continued, and this measure now holds a clear third place.
- Tax band pressure eases. Demand for more favourable employee tax bands has eased for the second year running, from 18% first choice before Budget 2025 to 12.5% last year and 10.2% now, consistent with the income-tax reform that Budget 2026 began to phase in.
Survey Methodology
This online survey was carried out between the 5th and the 19th of October 2026. The survey was hosted on Malta Survey’s website - www.maltasurvey.com.
Respondents were recruited through paid advertising. The advertising audience mirrored the composition of Malta's population aged 16 and over and was not restricted to Malta Survey followers. We used no contact lists or pre-existing datasets, so we cannot identify any participant.
Each submission was verified through a series of automated checks and guards to prevent duplicate responses and ensure the legitimacy of the data. Participants had the option to carry out the survey either in Maltese or English, and an effort was made to ensure that all questions were neutral and non-leading. All submissions were gathered through Malta Survey’s online platform and the anonymity of the sample base was ensured. Analysis was done using data science tools.
Sampling & Weighting
The sample is a quota-controlled, non-probability online sample. Quotas on gender, age and region were managed during fieldwork by adjusting the advertising audience, so that the raw sample tracked the population profile as closely as possible. After fieldwork, post-stratification weights were applied so that the weighted sample matches the population of Malta aged 16 and over on all three variables.
Data Security & Privacy
Malta Survey adhered to strict protocols to protect the confidentiality and integrity of responses. All data transmissions are encrypted, and no personal information is stored in the survey’s dataset.
Limitations & Disclaimer
Whilst Malta Survey’s digital polling methodology is designed to minimise errors and biases, it is important to acknowledge potential limitations. The reliance on digital technology means that individuals without internet access may be underrepresented. Despite efforts to ensure a representative sample, the self-selecting and fully voluntary nature of respondents could introduce some level of response bias. However, like all survey methods, it is subject to inherent limitations that are diligently mitigated through the design and execution of the polling process. Year-on-year comparisons should be read with each survey’s margin of error in mind: a movement of one or two percentage points is within sampling variation, while the larger shifts highlighted in this report are well outside it.
Margin of Error
As of 11 April 2022, Malta's population aged 16 and over stood at 447,456. A simple random sample of 913 drawn from that population would carry a margin of error of ±3.2% at the 95% confidence level. Accounting for a Kish design effect (DEFF) of 1.22 increases the margin of error to ±3.6%. These figures are offered as a guide to precision rather than as a strict statistical guarantee, since a classical margin of sampling error assumes a probability sample and this survey, like all opt-in online surveys, is not one. Sub-groups carry wider margins.
Findings
Demographic Analysis of the Sample
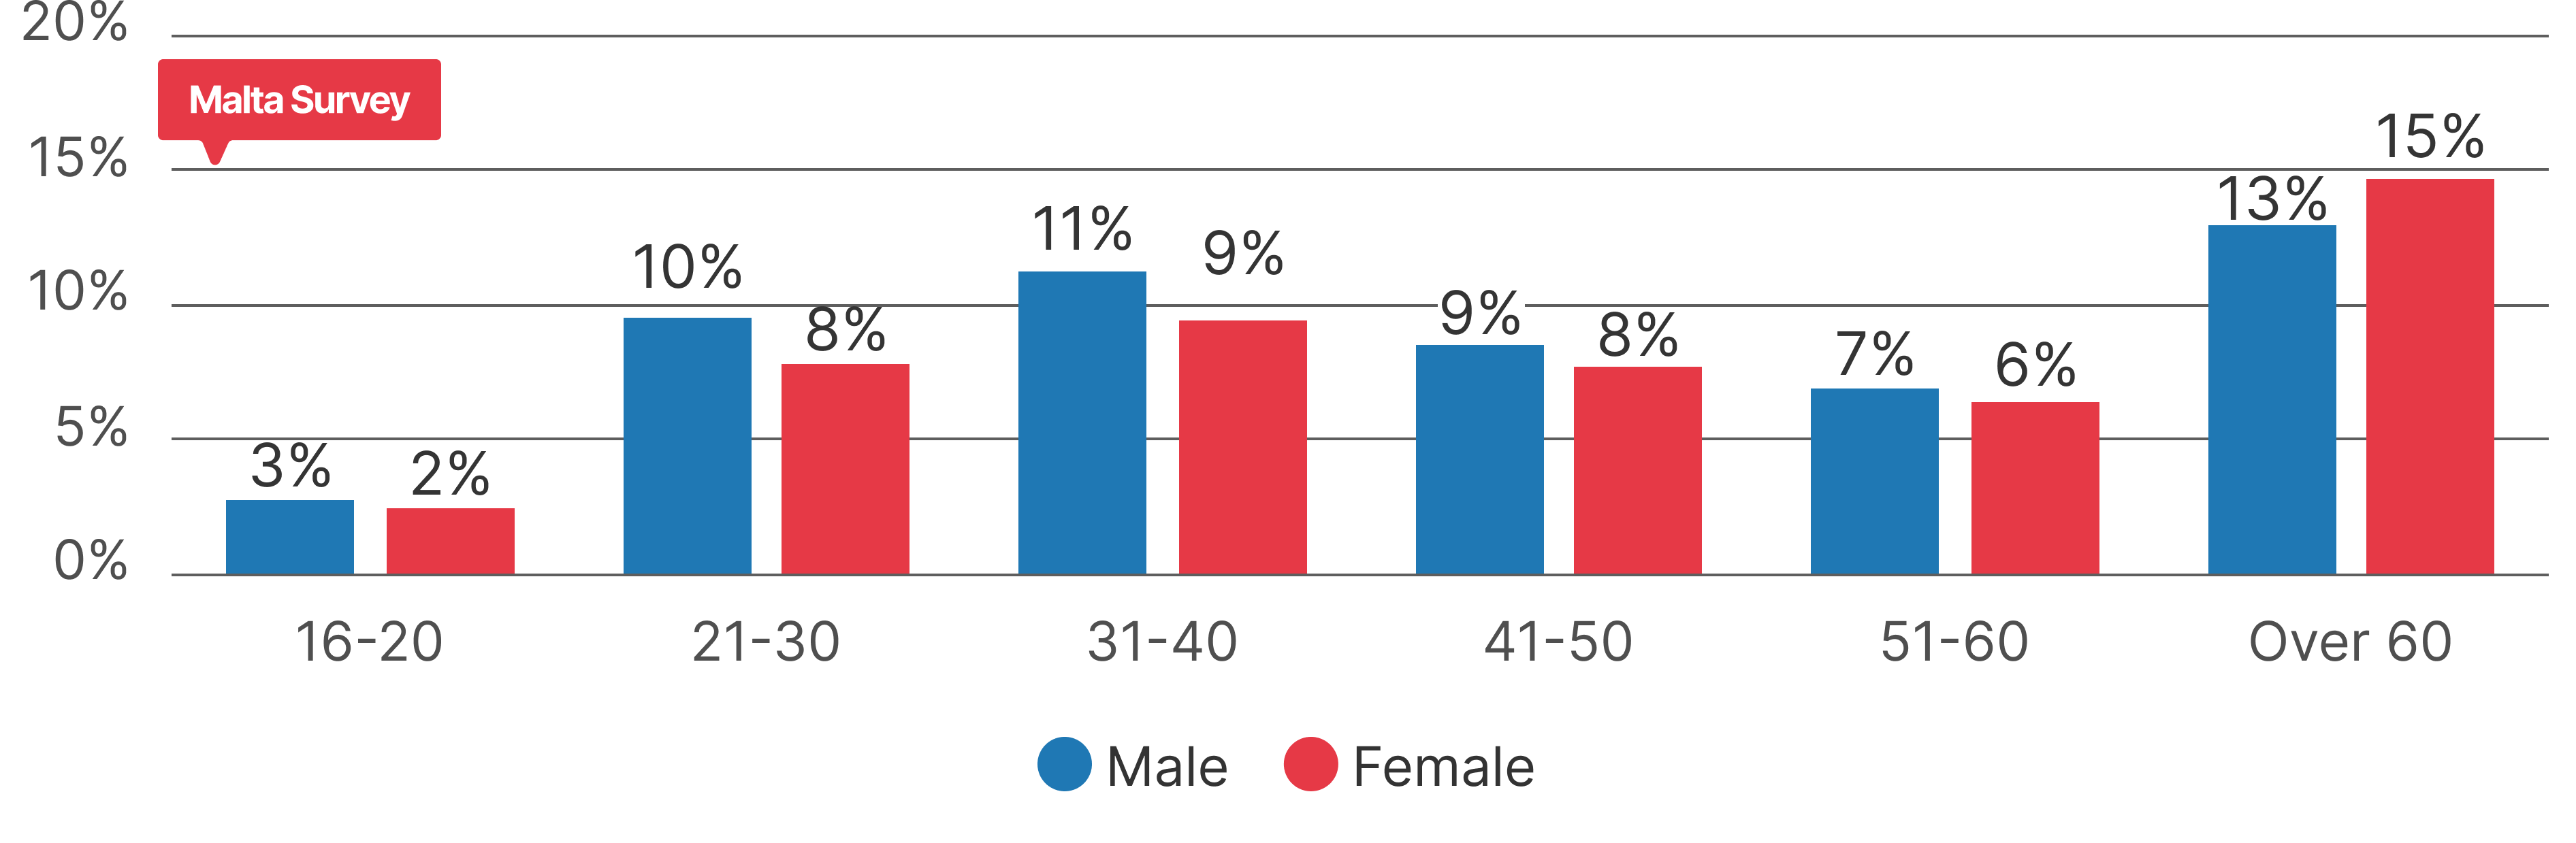
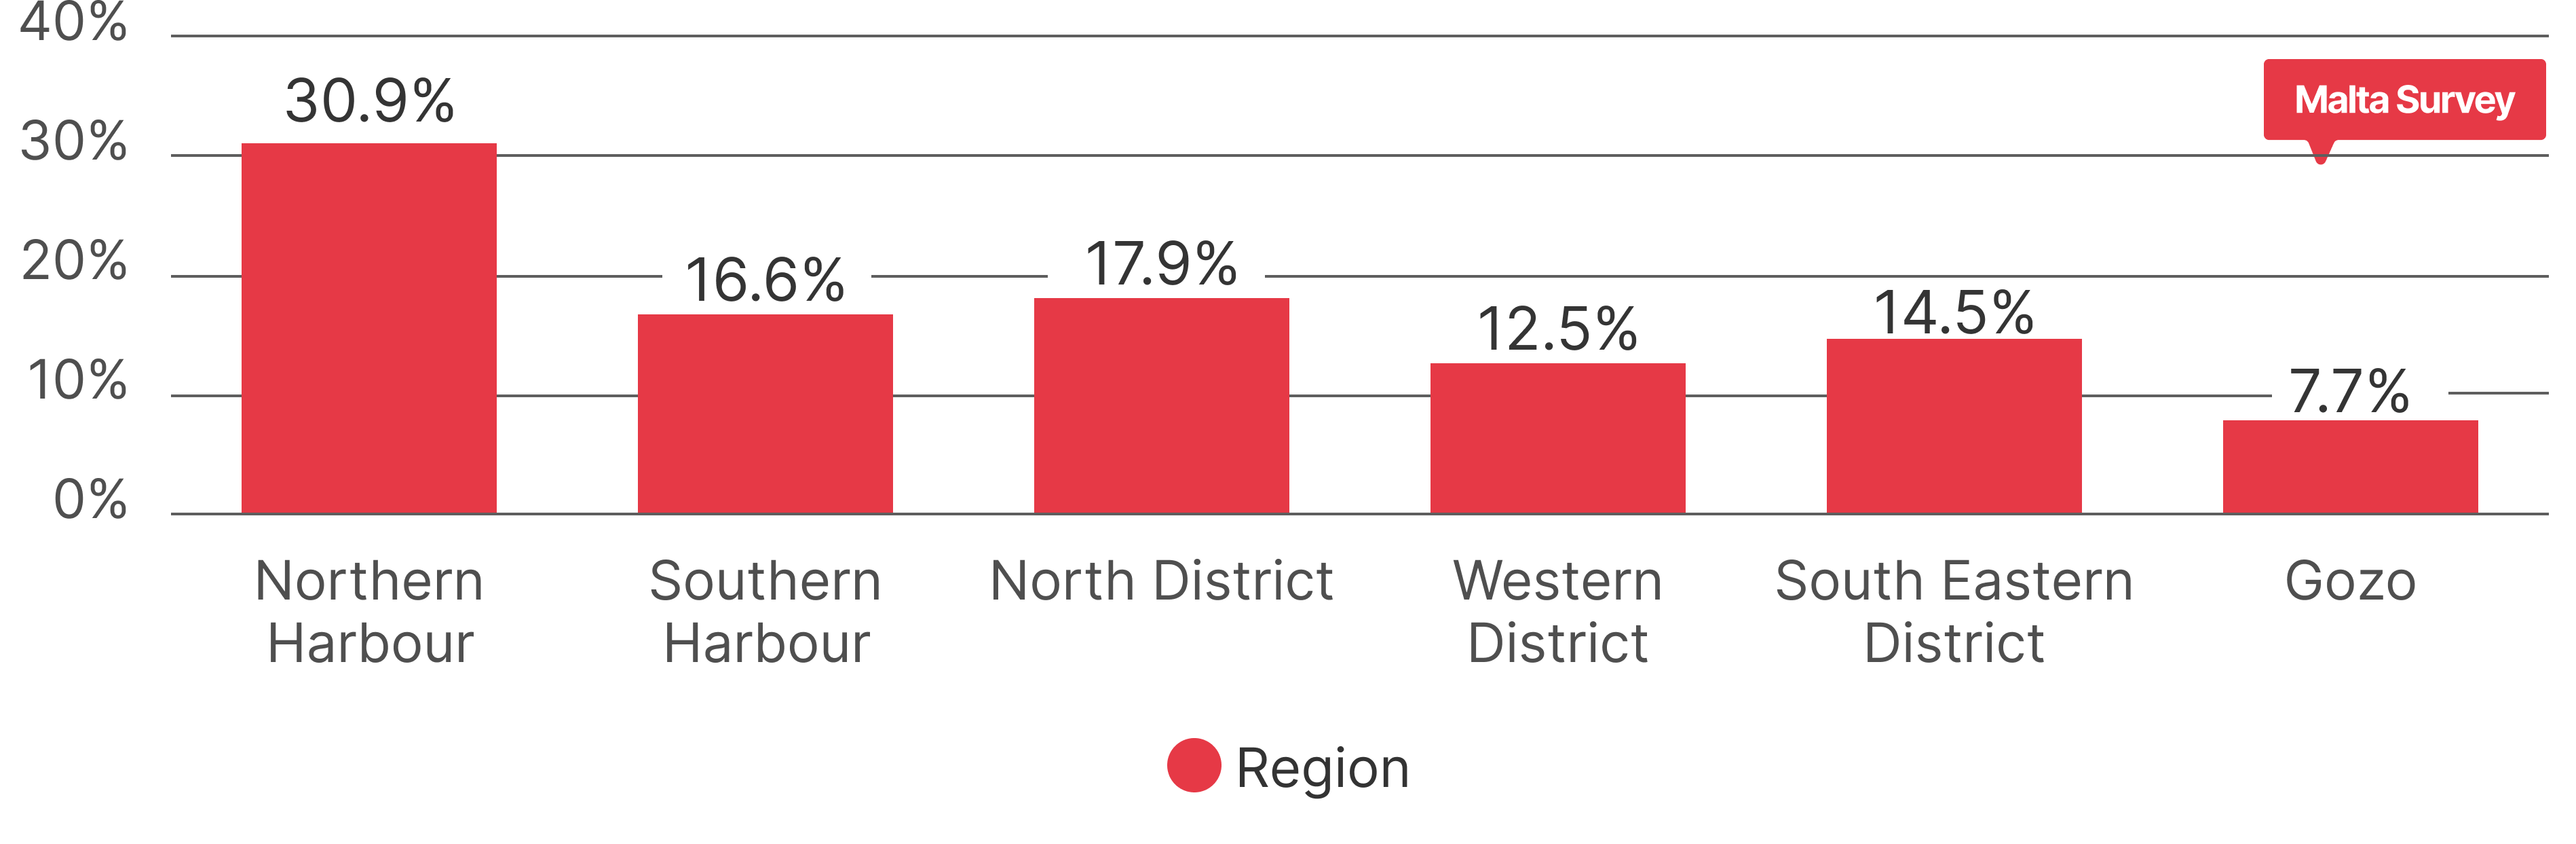
The sample includes 913 participants, with 51.8% males and 48.2% females, distributed across different age groups. The age profile is very close to that of the previous two surveys: the over-60s form the largest group at 27.5% of the sample, followed by the 31-40 age group at 20.6%. The regional distribution suggests the sample represents the Maltese population, with the Northern Harbour region accounting for 30.9% of respondents and Gozo for 7.7%.
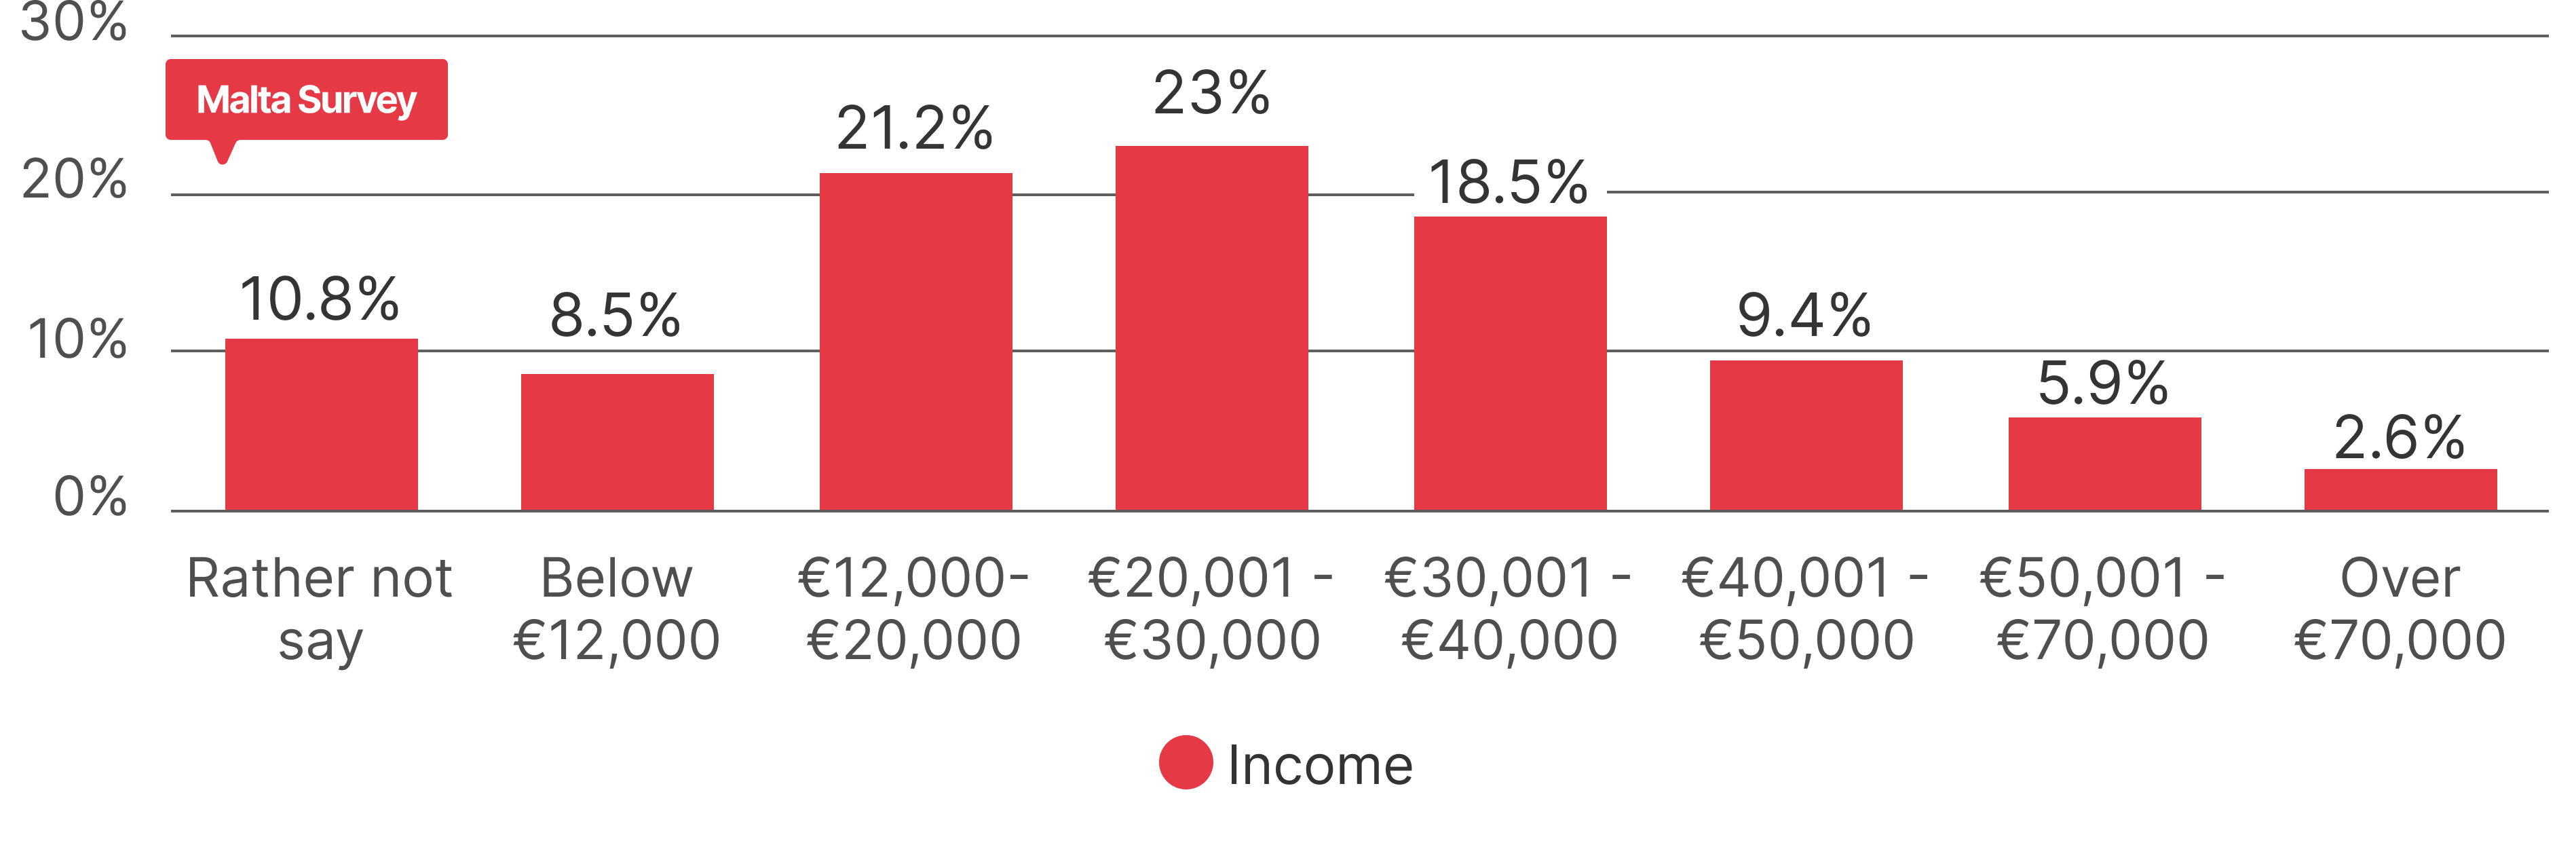
The income distribution of this sample peaks within the €20,001 to €30,000 annual income bracket (23% of respondents), with the €12,000 to €20,000 bracket close behind at 21.2%. Compared with last year, the sample is slightly less concentrated at the lower end: the share reporting an income below €12,000 fell from 11.9% to 8.5%, while the €30,001 to €40,000 bracket grew from 15.4% to 18.5%. As in the previous year, around one in ten participants (10.8%) chose not to disclose their income bracket.
The online survey had the following research questions:
- What are the important priorities that should be placed during the upcoming budget?
- What measures should the Government take to reduce the current deficit?
- What economic sectors are to be prioritised during the upcoming budget?
- What is the confidence that this year’s budget will deliver on the expectations of the public?
Priority Sorting
As in last year’s report, ranking questions are analysed using a weighted scoring method that incorporates all three ranking positions, rather than first preferences alone. Ranking by first preference alone, though straightforward, discards valuable information by ignoring second and third choices (Alwin & Krosnick, 1985). Instead, we applied a weighted scoring system: first-place selections received 3 points, second-place selections received 2 points, and third-place selections received 1 point. This approach aligns with established decision theory principles, particularly Saaty’s (1977) work on scaling methods for priorities in hierarchical structures, which demonstrates that weighted aggregation of ranking preferences provides a more robust representation of overall priorities than single-position analysis. The weighted method captures both the intensity of top preferences and the breadth of support across all ranking positions, offering a more complete picture of respondents’ priority structures (Orme, 2009).
For the three-year comparisons in this report, the same 3-2-1 weighting has been applied retrospectively to the Budget 2025 and Budget 2026 results, so that all three years are ranked on an identical basis. The weighted score shown in the comparison charts is expressed per respondent (for example, a measure chosen first by everyone would score 3), which makes the figures comparable across surveys of different sizes.
Important Measures expected from Budget 2027
The first ranking question offered eleven possible budget measures and asked respondents to pick the three they most wanted to see in Budget 2027, in order. The list spans price controls (food, medicines, property, rent), income measures (wage structures, tax bands, one-time bonuses), and reviews of social benefits and of the subsidies paid to families and to businesses.
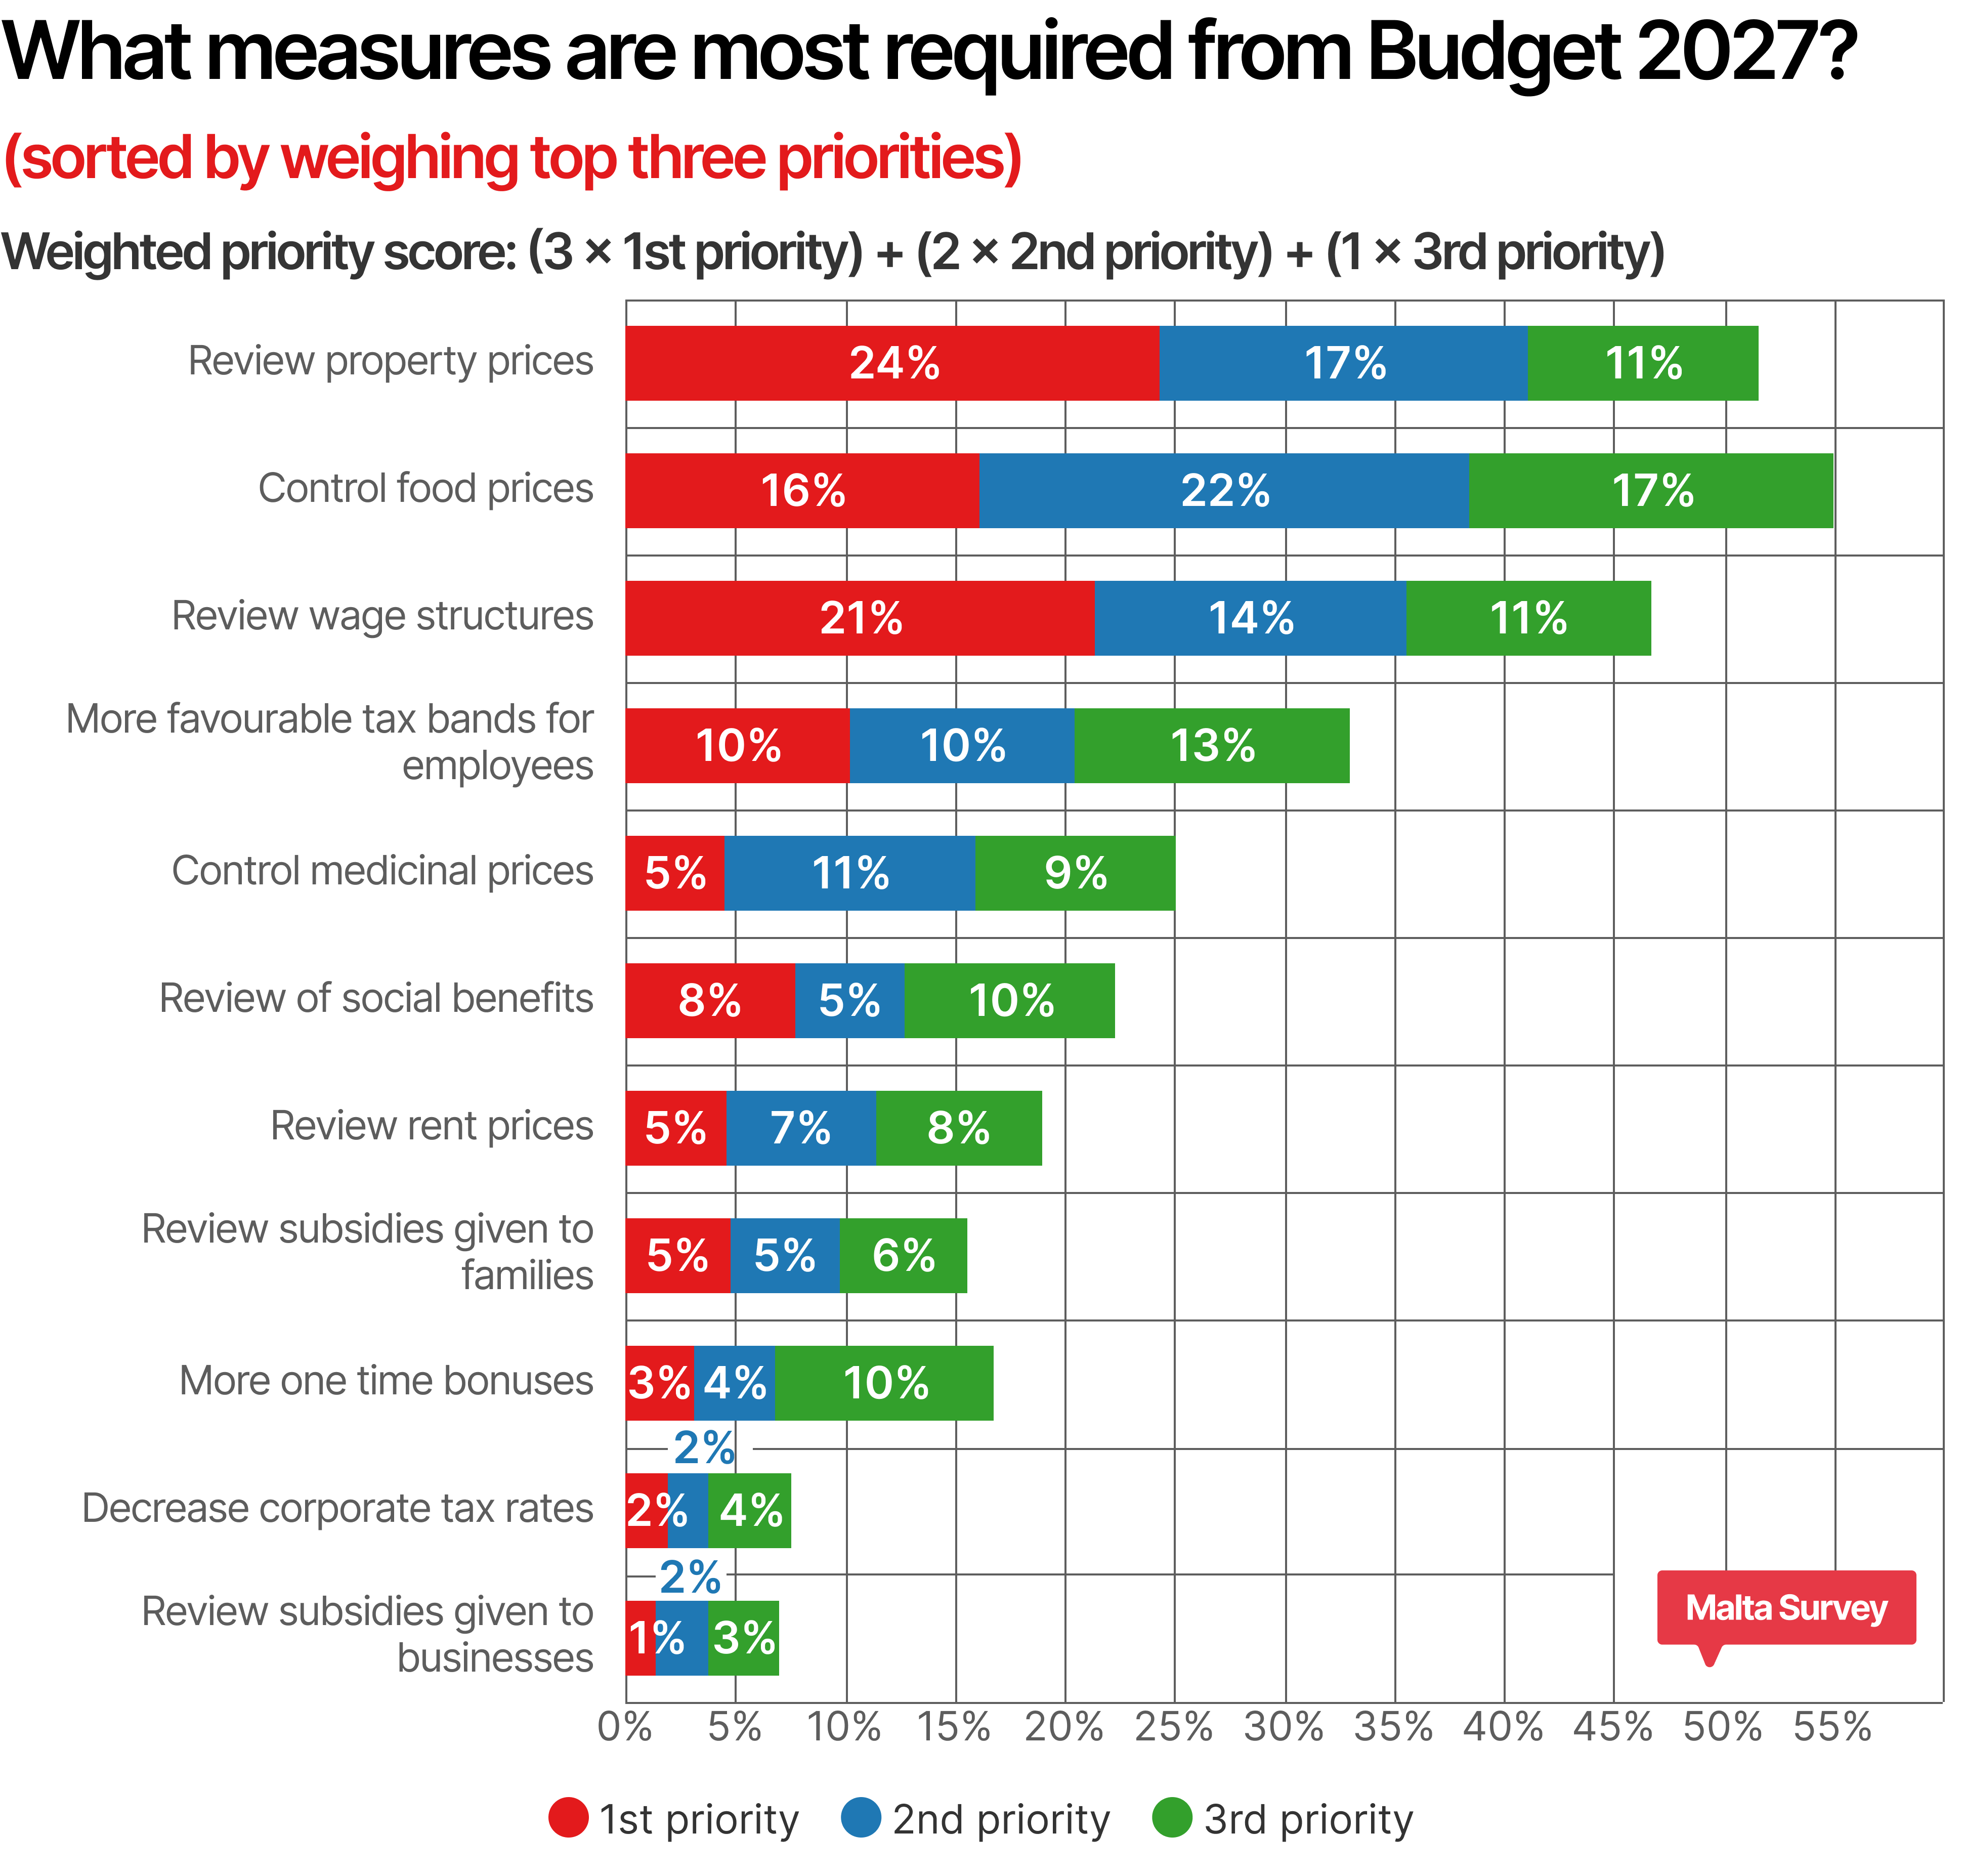
Counting first choices only, a review of property prices leads for the first time in the survey’s history: 24.3% of respondents put it at the top of their list. A review of wage structures, which led the first-choice count in both previous editions, ranks second at 21.4%, and controlling food prices ranks third at 16.1%. More favourable tax bands for employees collect 10.2%. None of the other seven measures reaches 8% as a first choice; they matter a great deal to particular groups, as the age analysis below shows, but not to the sample as a whole.
When the weighted scoring system incorporates second and third preferences, reviewing property prices remains first, with a weighted score of 1.17, followed by controlling food prices at 1.1 and reviewing wage structures at 1.04. Food prices remain the measure most likely to appear in a respondent’s top three (55.1% of respondents included it, against 51.7% for property prices), and it again attracted the highest share of second-place selections (22.3%). What has changed is the intensity of feeling about housing: property prices now draw the largest share of first-choice support, which carries the measure to the top of the weighted ranking. "More favourable tax bands for employees" is a clear fourth (0.64), well ahead of controlling medicinal prices (0.46) and reviewing social benefits (0.43).
The lower half of the list remains unchanged in character. Reducing corporate tax rates and reviewing subsidies to businesses remain the least preferred measures, each with under 2% of first choices and weighted scores of 0.13 and 0.12. One-off bonuses sit near the bottom (0.27), appearing mostly as a third choice. The public message is consistent with the previous year: people want measures that put money in household budgets through lower essential costs or higher incomes, rather than pro-business incentives or short-term handouts.
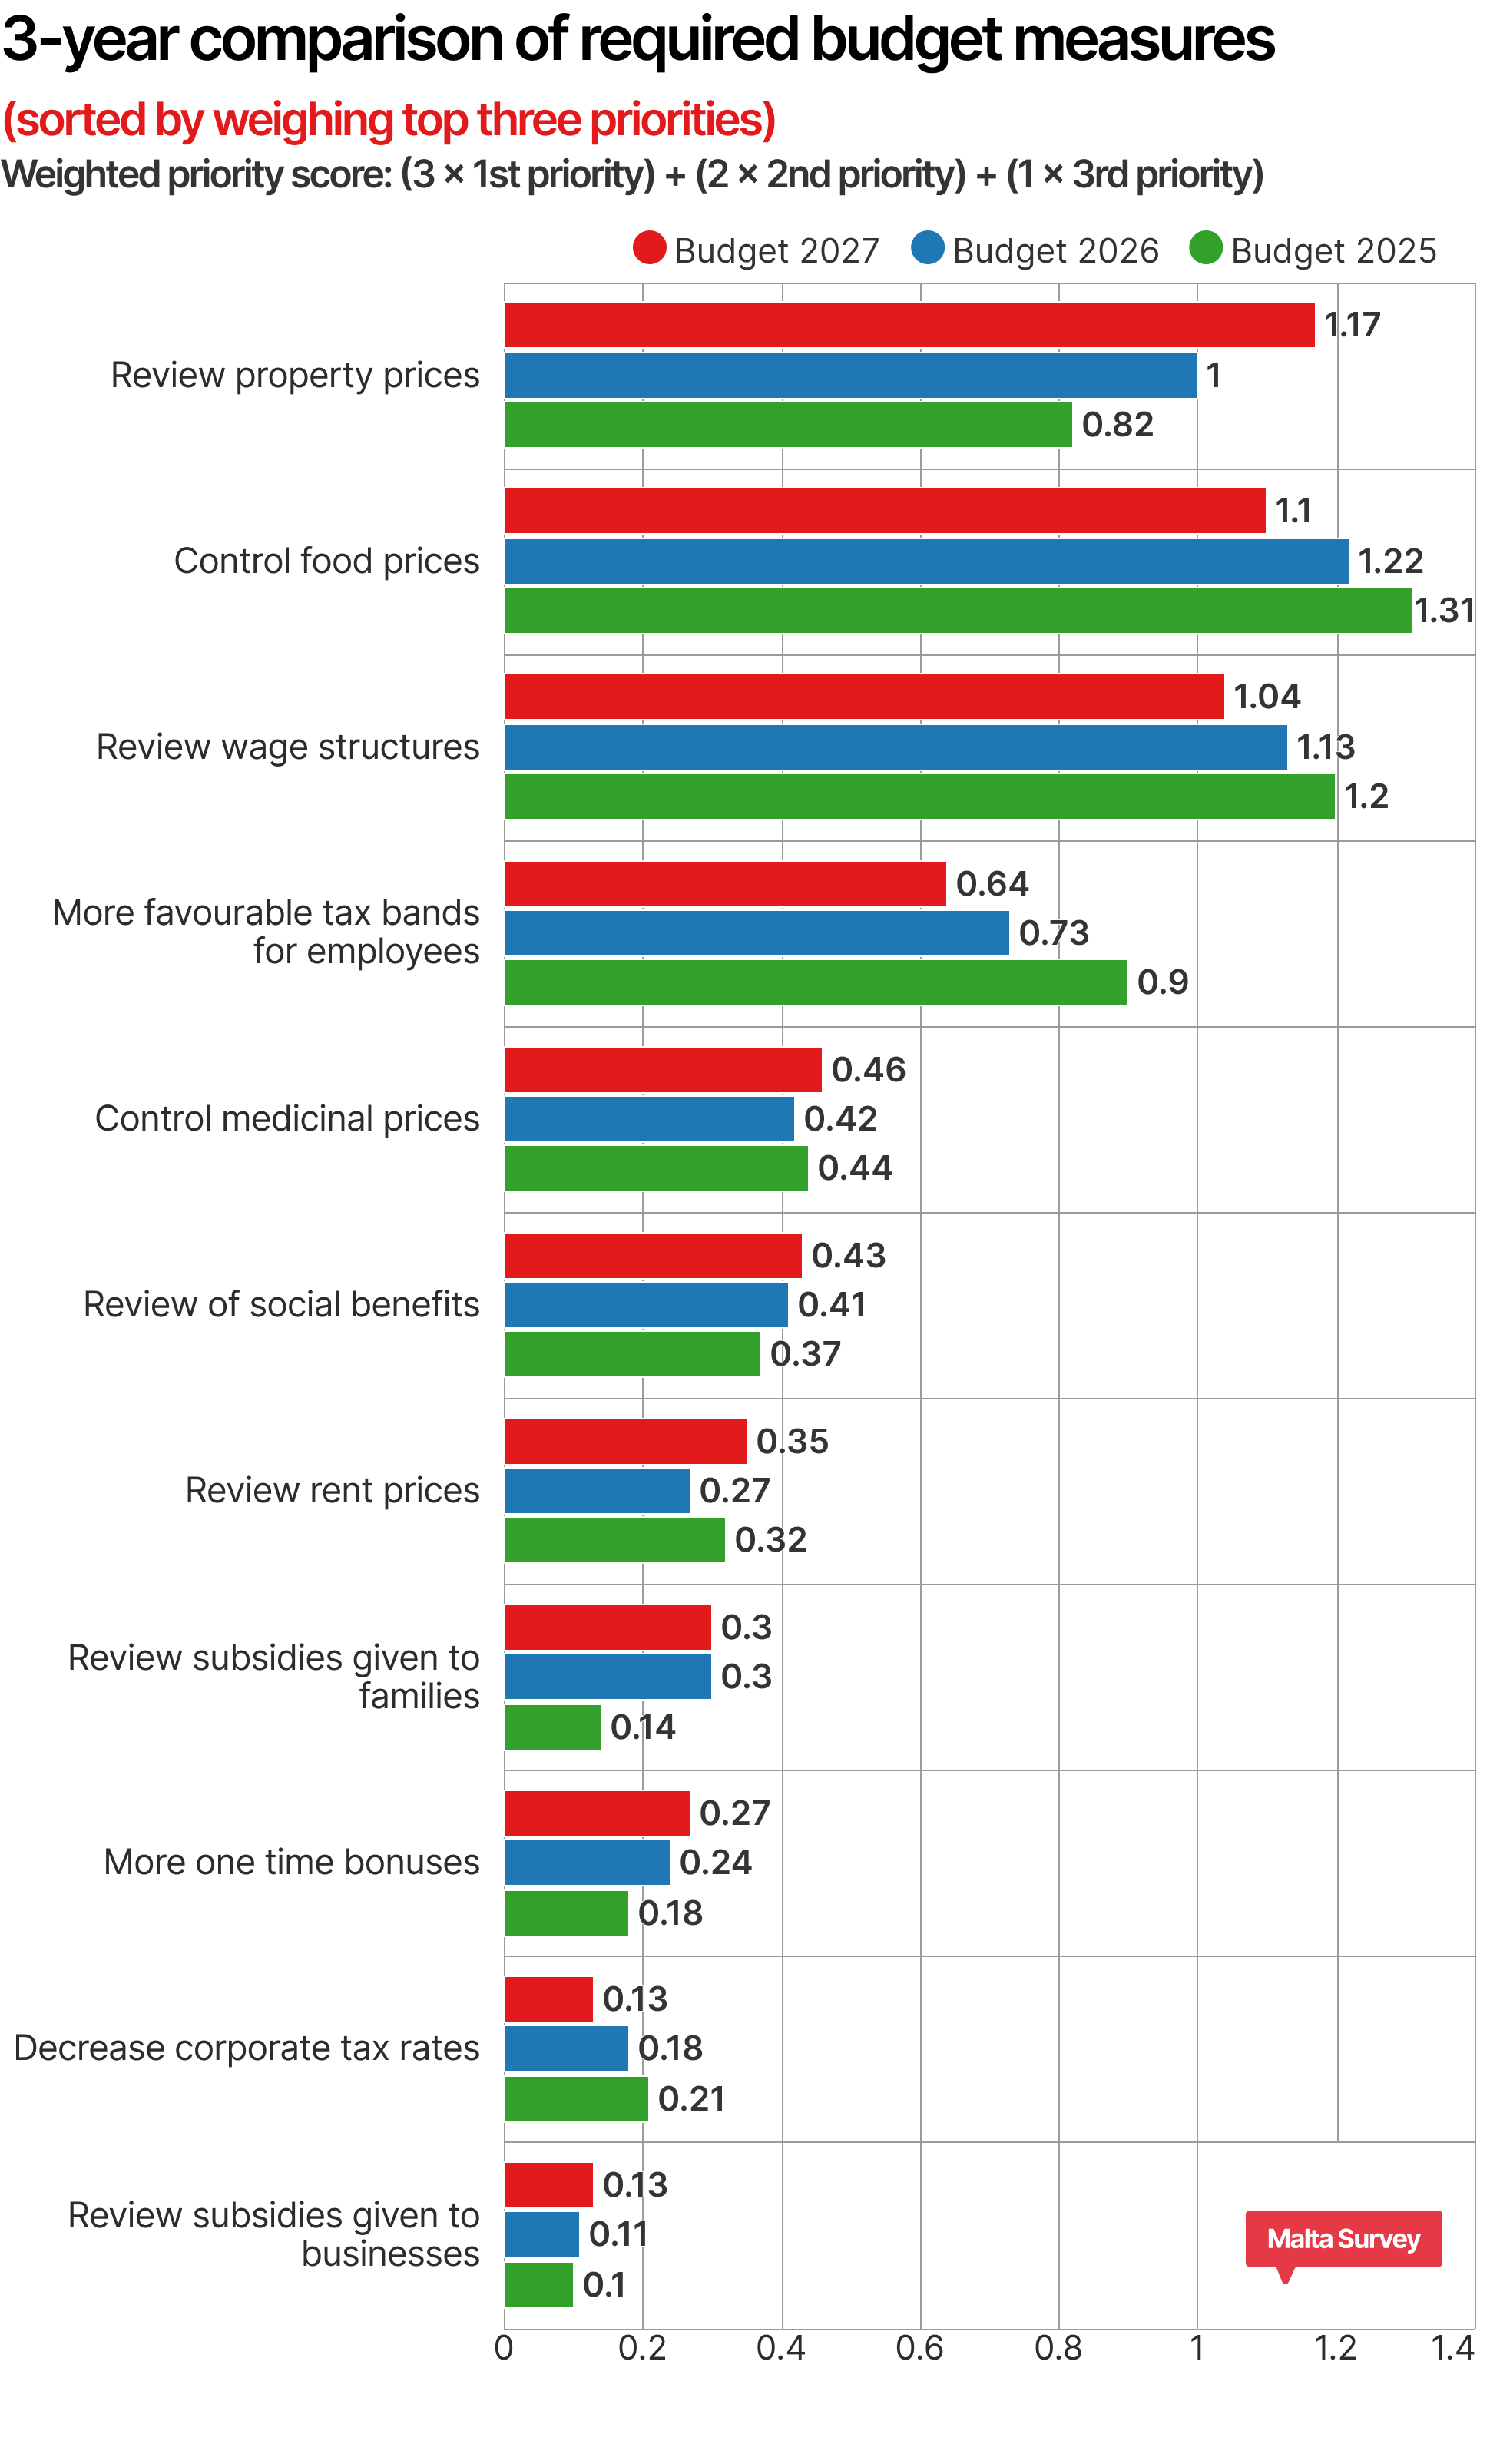
The three-year comparison shows a steady reordering of the top three. Controlling food prices was the clear leader before Budget 2025 (weighted score 1.31) and again before Budget 2026 (1.22), but its score has fallen in each survey and now stands at 1.10. Reviewing wage structures has followed the same path, from 1.2 to 1.13 to 1.04, with its first-choice share slipping from 27% to 24% to 21.4%. Reviewing property prices has moved in the opposite direction, from fourth place (0.82) to third (1) to first (1.17). Over the same period, its first-choice share nearly doubled, from 12.8% to 24.3%.
Rent prices tell the same story on a smaller scale. After dipping last year, the measure has recovered to its highest weighted score of the three surveys (0.35), with 4.6% of respondents placing it first. Taken together, the two housing measures (property and rent) now carry a combined weighted score of 1.52, compared with 1.27 last year and 1.15 before Budget 2025. No other theme in the survey has grown as consistently.
The fourth-placed measure, more favourable tax bands for employees, has eased for the second year in a row, from 0.9 before Budget 2025 to 0.73 last year and 0.64 now. This decline coincides with the widening of income tax bands announced in Budget 2026 and phased in from January 2026, and it is reasonable to read it as some of that demand having been met, at least for the families who benefited. By contrast, subsidies given to families doubled in weighted score between the Budget 2025 and Budget 2026 surveys (0.14 to 0.3) and have held at that level this year.
Dissecting first priority measures by age
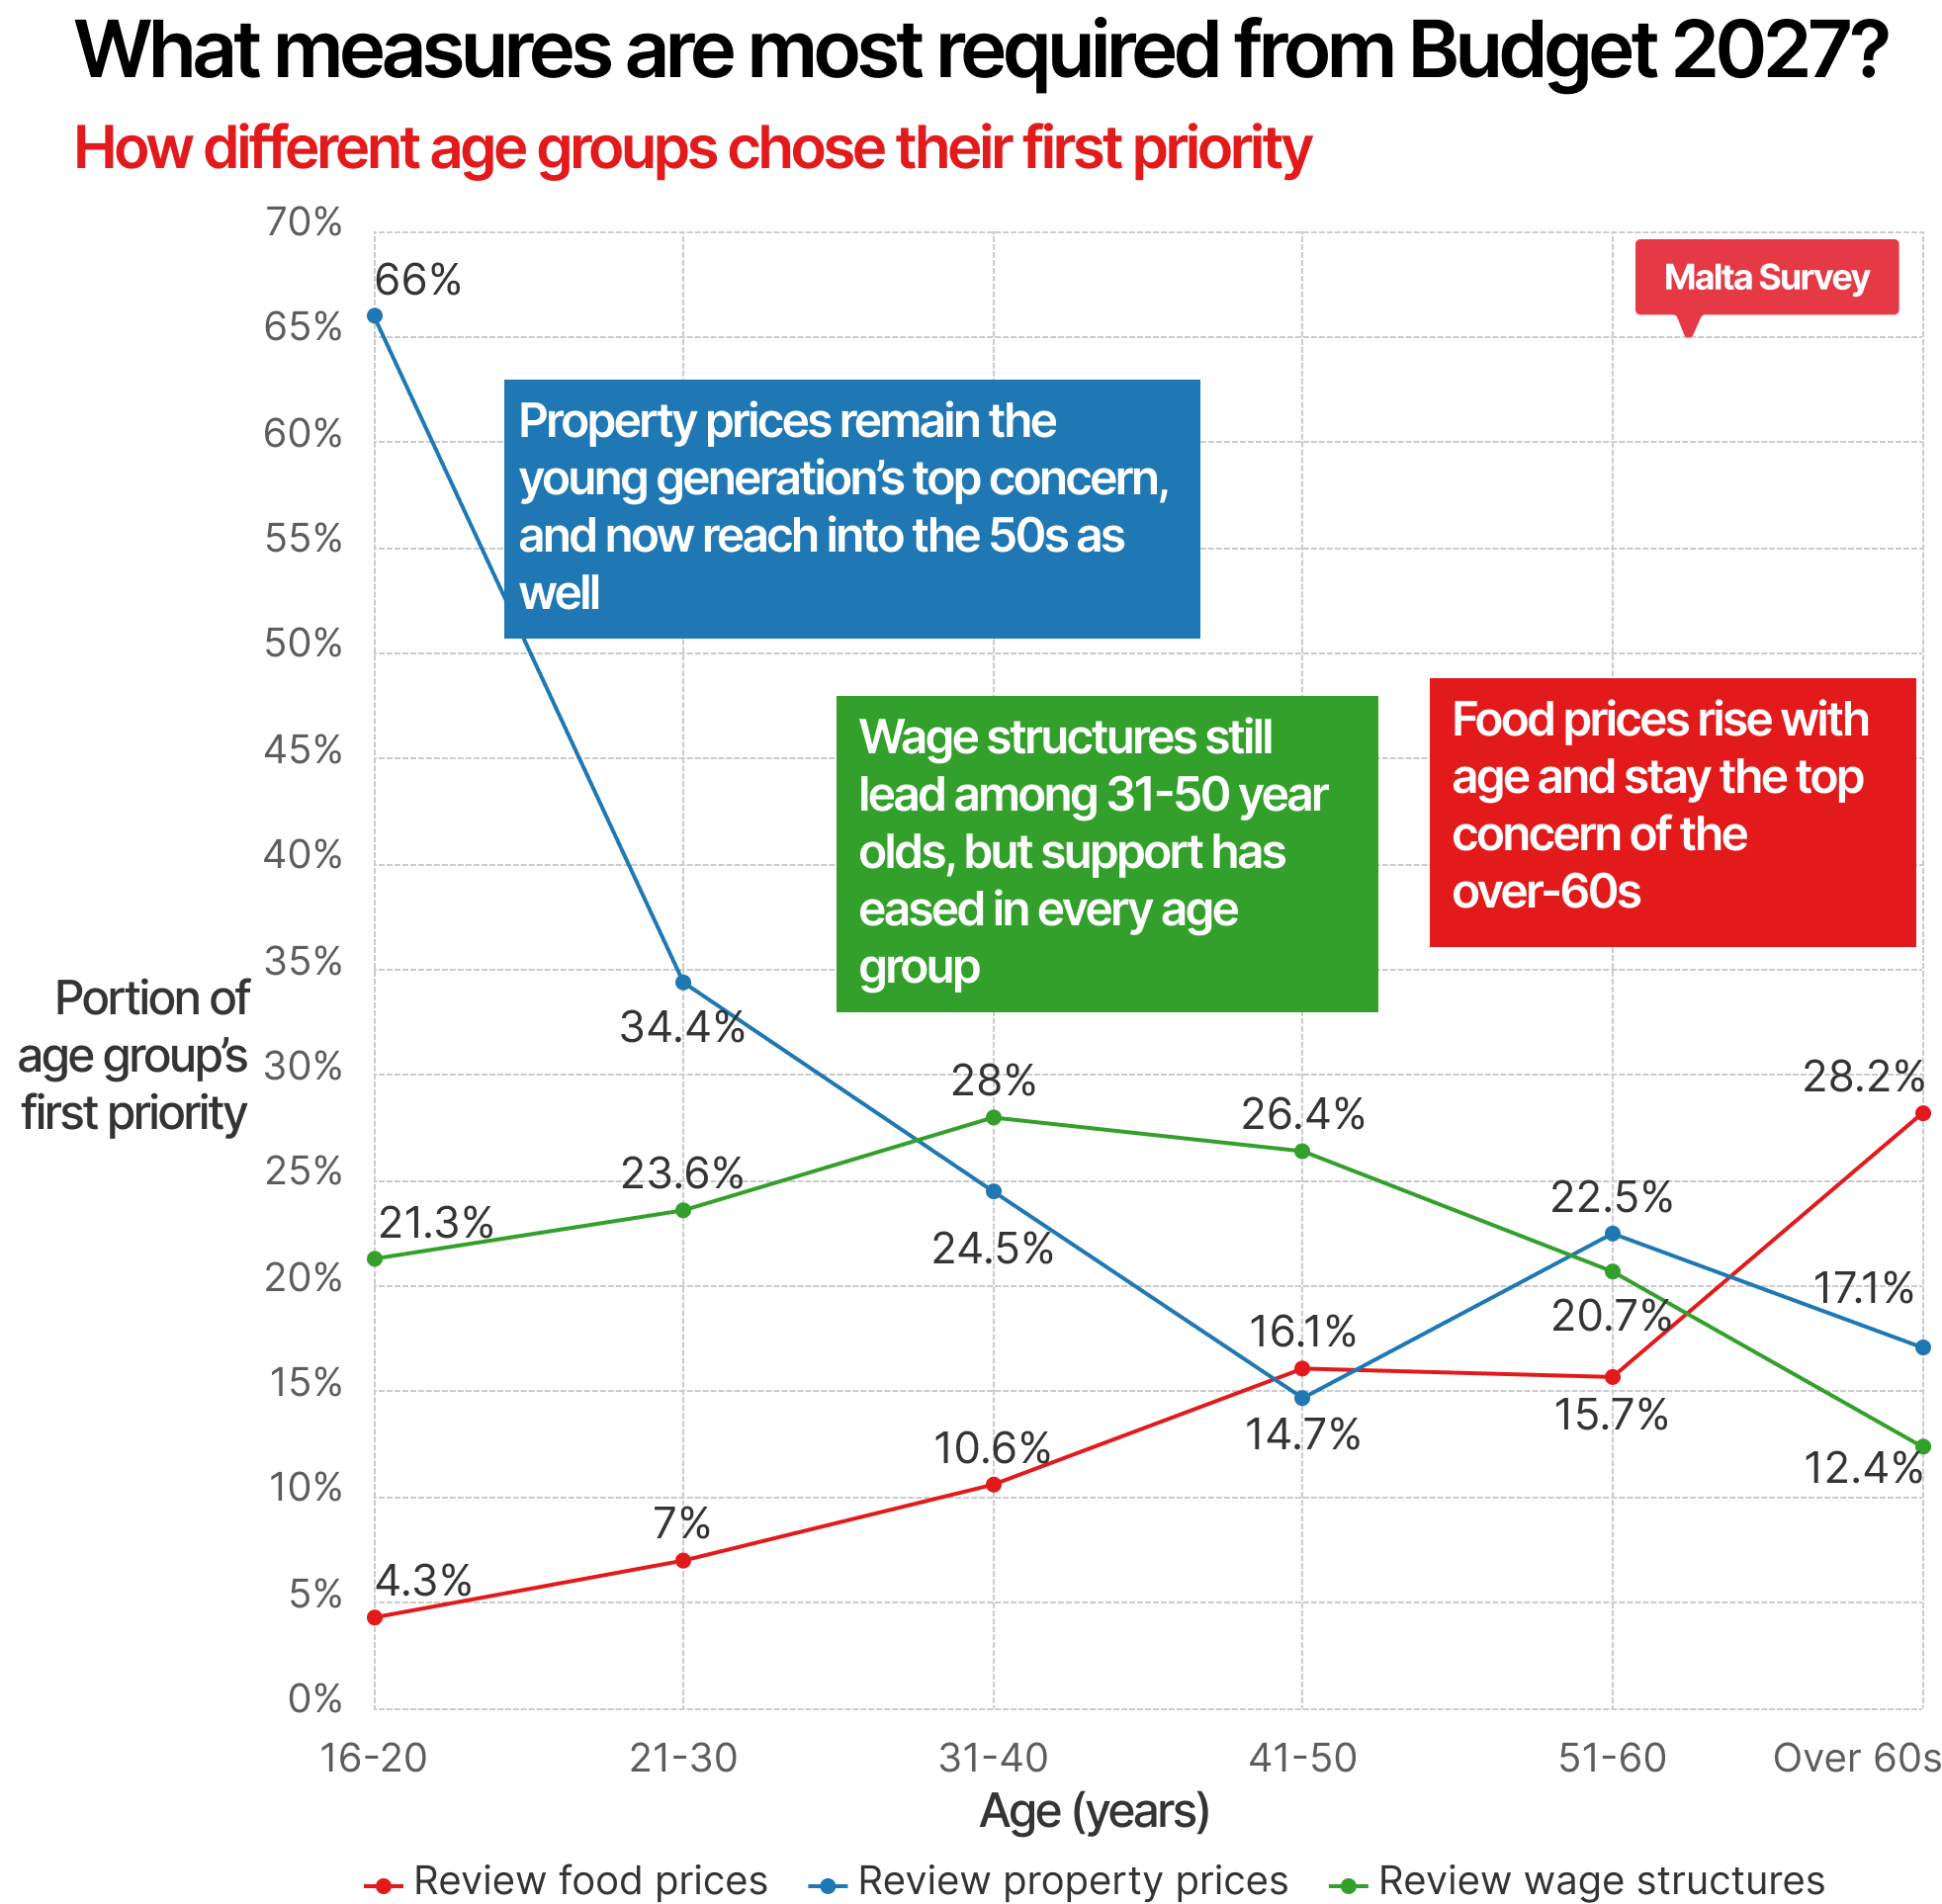
Broken down by age, the three-band pattern last year’s survey produced (property for the under-30s, wages for those aged 31 to 60, food for the over-60s) is still visible, but its edges have blurred, and housing is the reason. Property prices dominate among the youngest respondents: 66% of 16-20-year-olds and 34.4% of 21-30-year-olds put a review of property prices first. A review of wage structures remains the leading concern of working-age adults, taking the top spot among 31-40-year-olds (28%) and 41-50-year-olds (26.4%), although its share has eased in every age group compared with last year. Among 51-60-year-olds, property prices (22.5%) have overtaken wages (20.7%) as the top choice; last year, this group favoured wages. Food prices climb steadily with age, from 4.3% among 16-20-year-olds to 28.2% among those over 60, for whom they are the leading first choice.
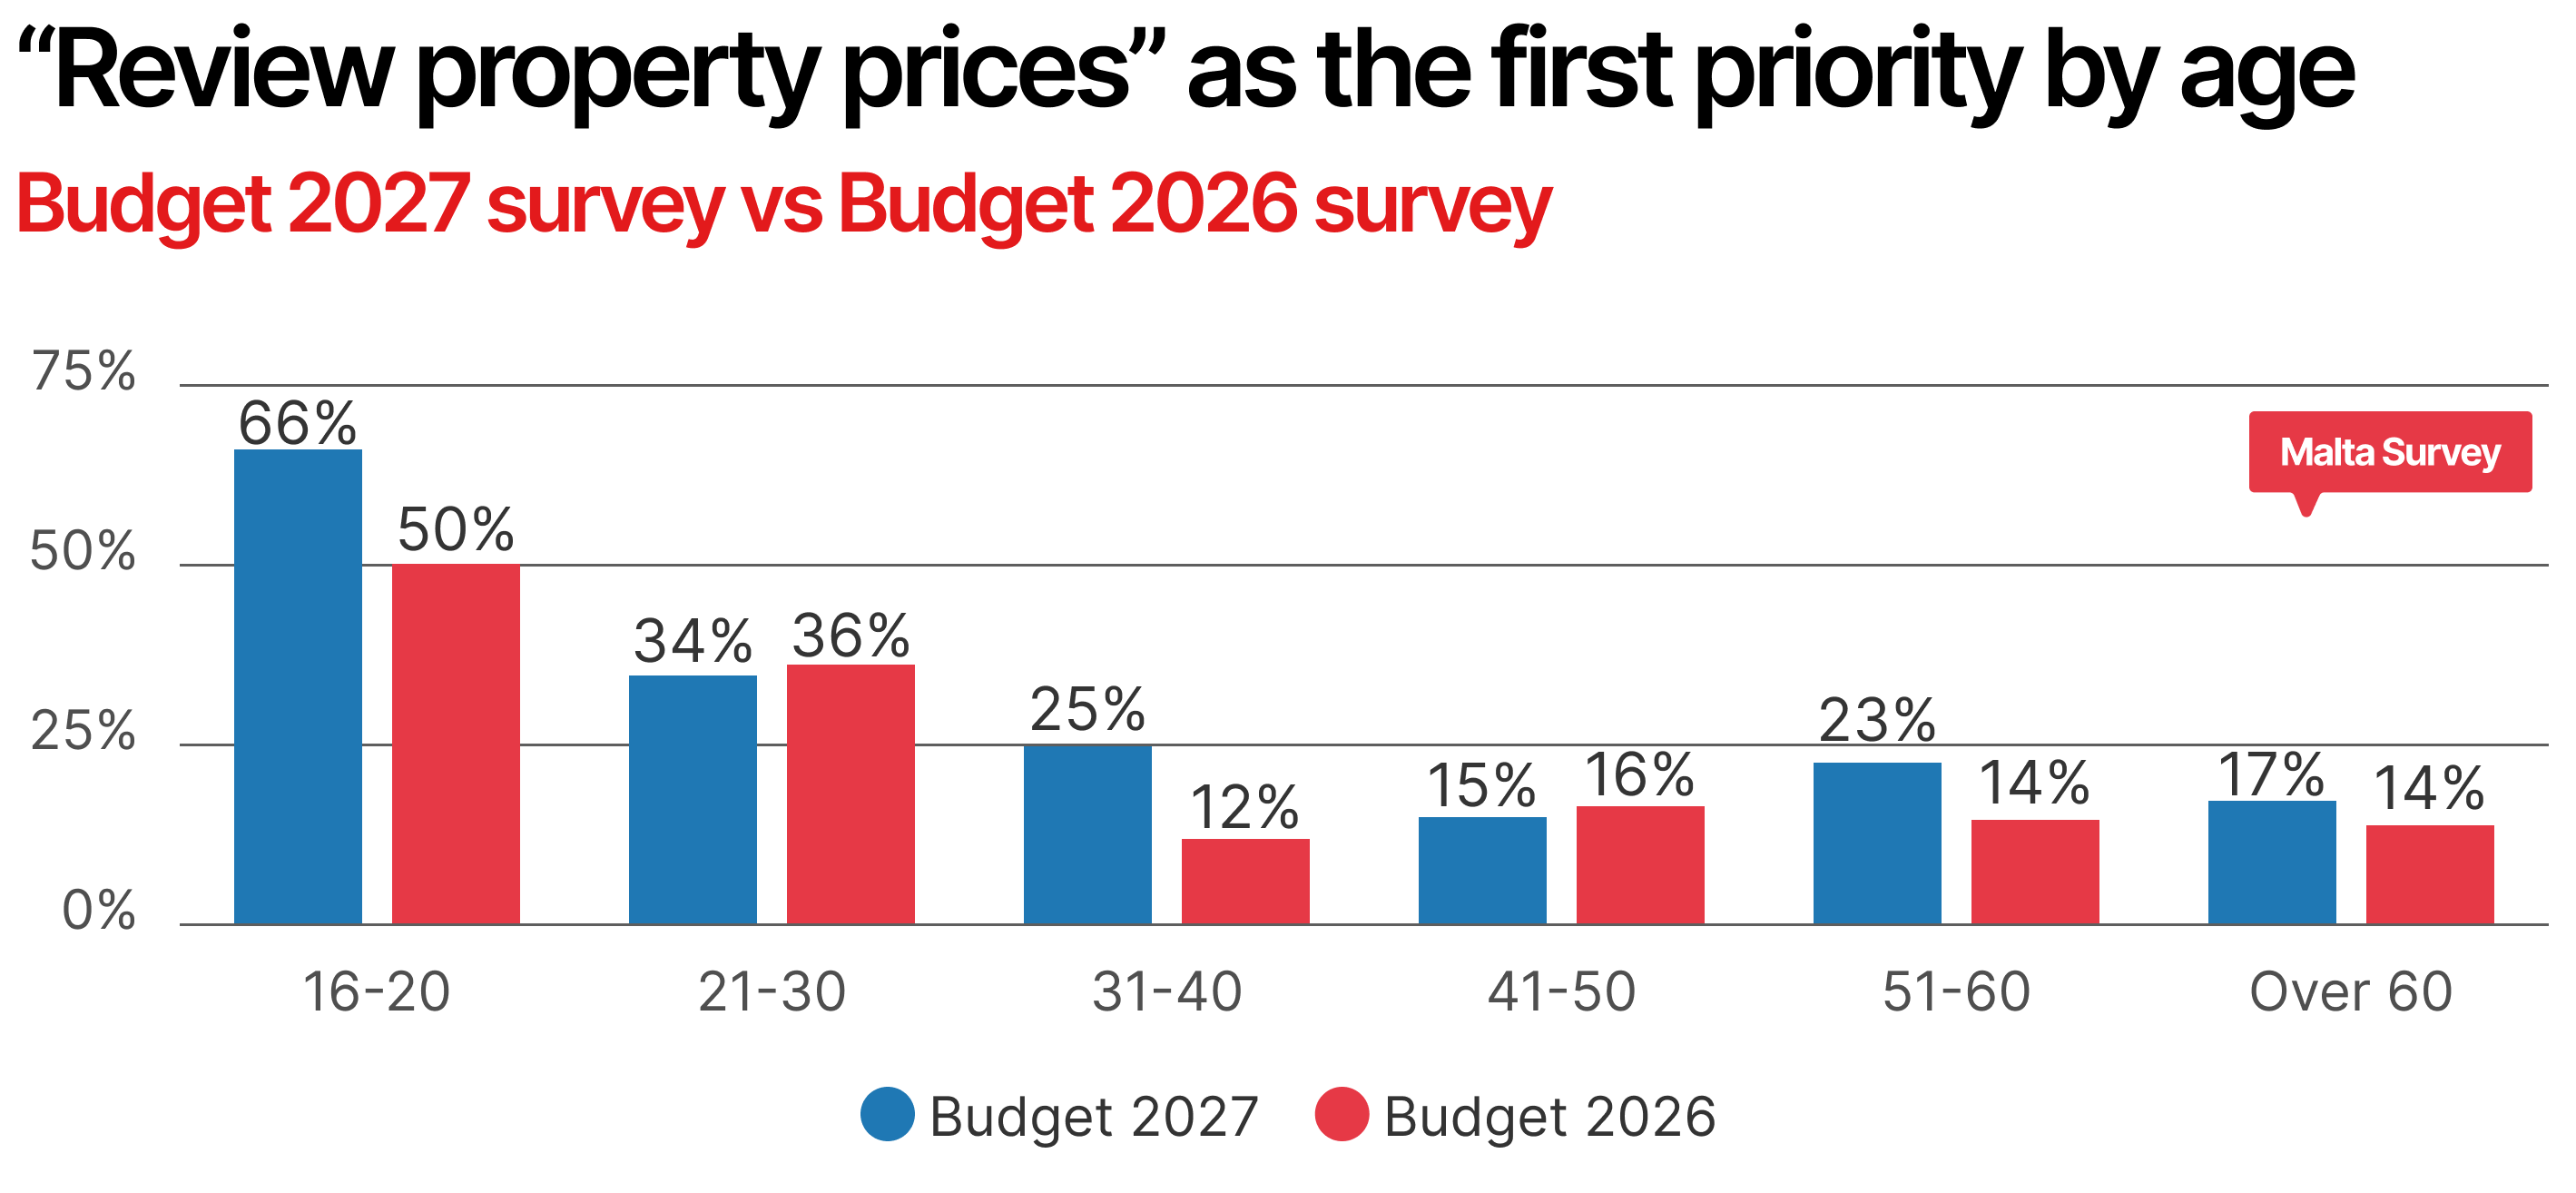
The shift since last year is clearest when property prices are tracked by age across the two surveys. Among 31-40-year-olds, the share putting property prices first has more than doubled, from 11.7% to 24.5%, so housing is now almost level with wages in this group. Among 51-60-year-olds, the share rose from 14.4% to 22.5%, and among those over 60, from 13.8% to 17.1%. Among 16-20-year-olds, it rose from 50% to 66%, though we must remind readers of margins of error and how they increase when considering a subset of the sample. Only the 21-30 and 41-50 groups are essentially unchanged. In other words, concern about property prices is no longer confined to those trying to enter the market; it now extends to people in their thirties who may be trying to move up, and to older respondents who are likely to be watching their children’s prospects.
Other (non-top-3) measures with an age pattern
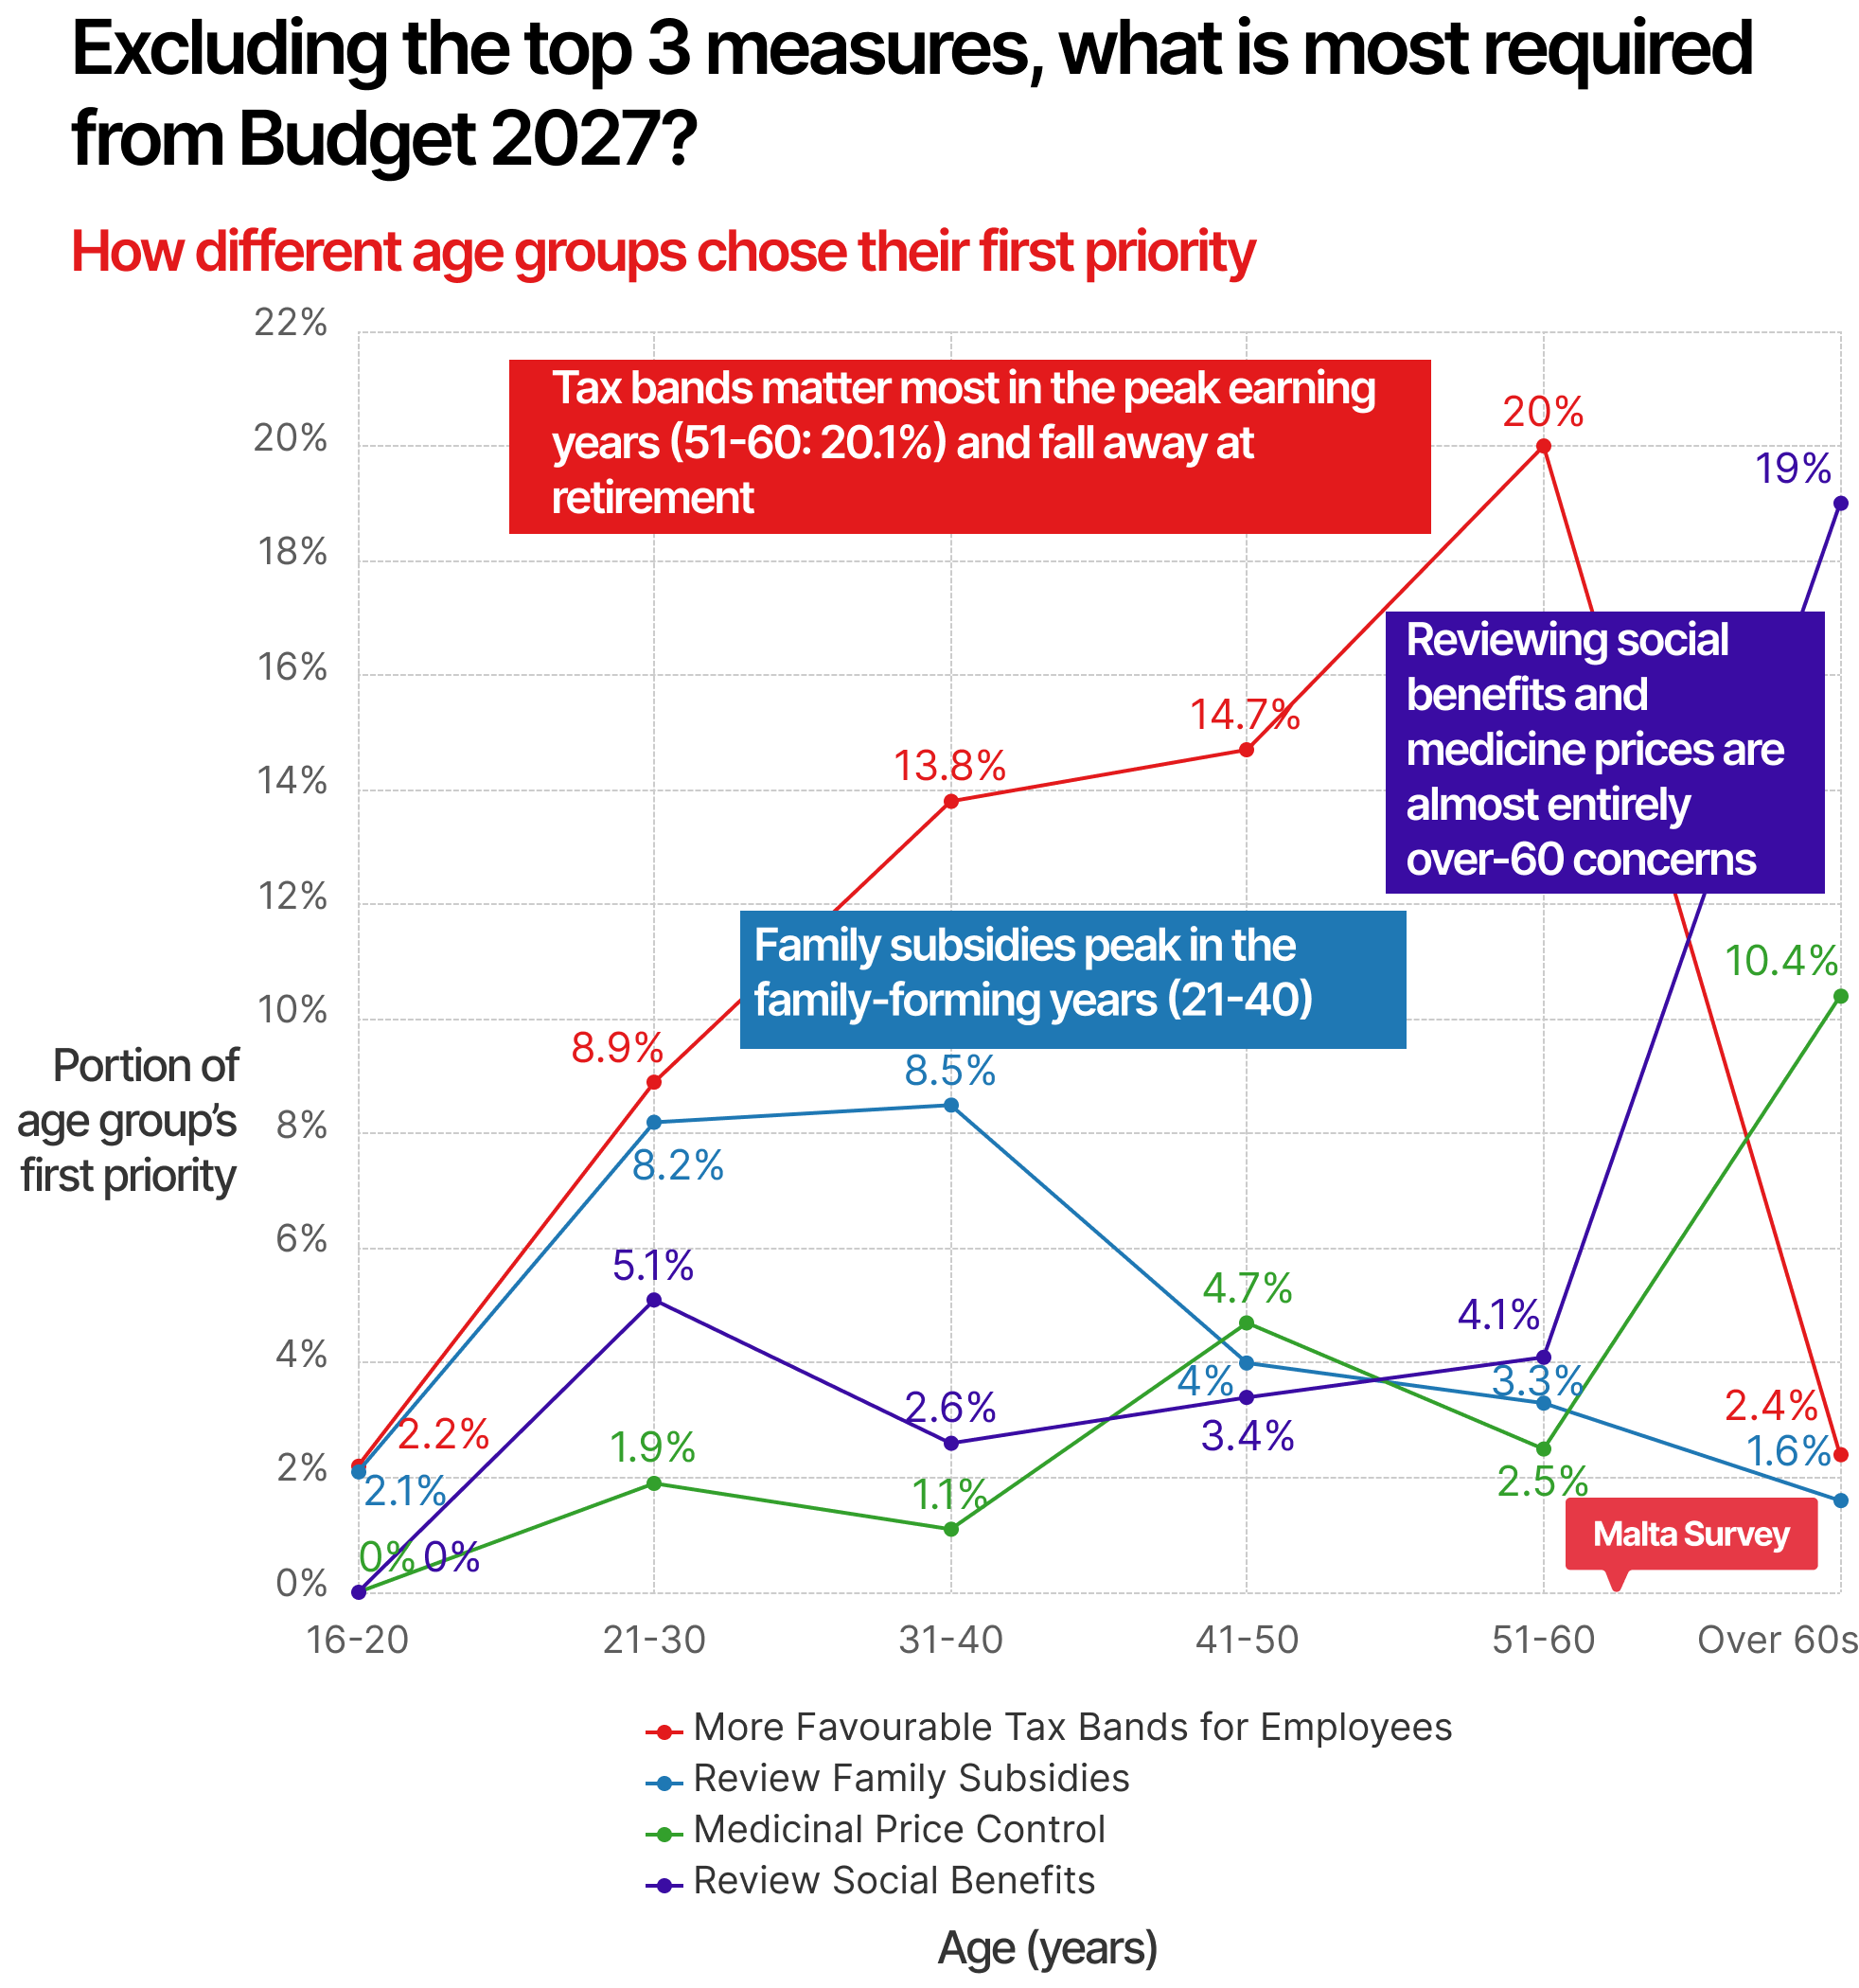
Beyond the three headline measures, two further measures show a clear age signature in this year's data. More favourable tax bands for employees follow the earning years: the share placing this measure first rises steadily from 9.0% among 21-30-year-olds to 13.7% (31-40), 14.6% (41-50) and 20.1% (51-60), and then falls to 2.4% among the over-60s. Among 51-60-year-olds, tax bands are tied with wage structures (20.5%) as the second concern after property, consistent with this cohort being most exposed to the upper tax bands. The second measure, a review of social benefits, is almost entirely an over-60 concern. It is the first choice of 18.9% of the over-60s, against 5% or fewer in every other age group, and for that cohort it ranks second only to food prices. Controlling medicinal prices shows the same shape on a smaller scale (10.4% among the over-60s, 5% or less elsewhere). The over-60s' list is therefore food, benefits, property and medicines: the priorities of households on fixed incomes. A smaller pattern is visible for subsidies given to families, which peak in the family-forming years at 8.0% (21-30) and 8.6% (31-40) and sit at 2% to 4% everywhere else.
Supported suggestions to control the current government deficit
The second ranking question turns to the other side of the ledger and asks how the public would prefer the Government to narrow the deficit. Five options were offered, all on the expenditure side: controlling spending by Government agencies and authorities, tighter means-testing of social benefits, a gradual reduction in public-sector headcount, rationalising assistance given to businesses, and cutting back spending on national projects. Respondents ranked their top three.
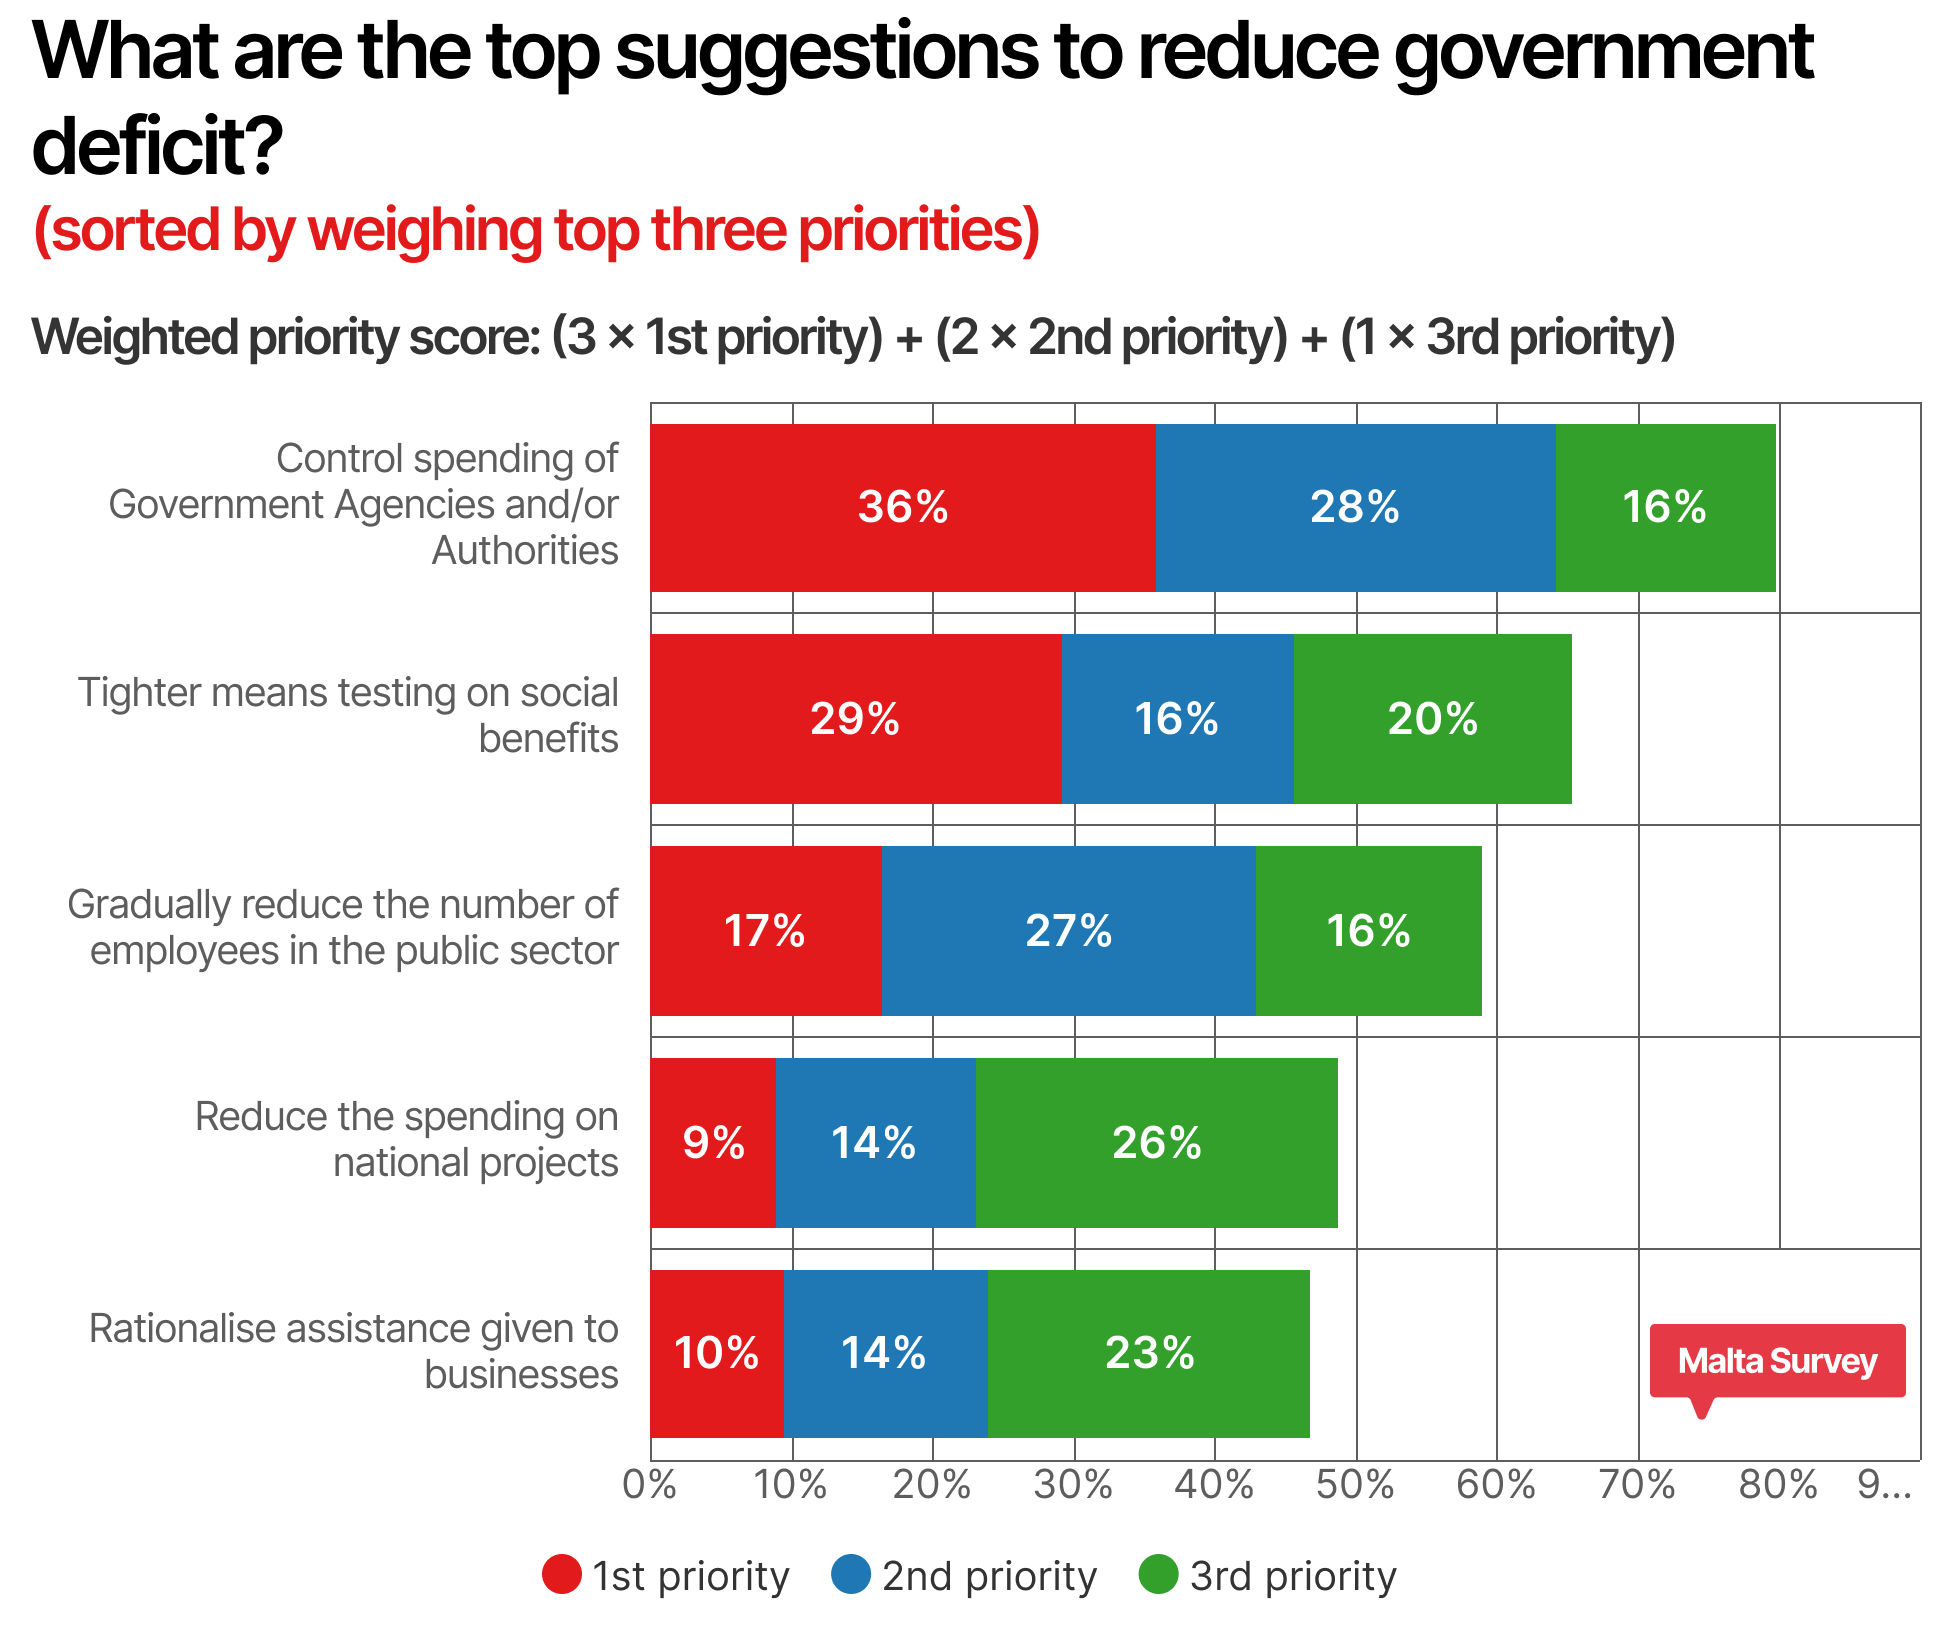
The sample's first preference is clear. Controlling the spending of Government agencies and authorities is the first choice of 25.8% of respondents, the second choice of 28.5% and the third of 15.6%; four respondents in five (79.8%) rank it somewhere in their top three, and its weighted score of 1.8 is far ahead of any alternative. It has led this question in every one of the last three surveys, and the consistency of the result points to a settled view that Government should look at its own outgoings before asking anything of households.
Tighter means-testing of social benefits is the second most popular measure, chosen first by 29.2% of respondents and included in the top three by 65.4%. The wording matters here: respondents are not asking for benefits to be cut, but for eligibility to be checked more carefully so that support goes where it is needed. Its weighted score (1.4) has drifted down slightly over three surveys (1.49, 1.44, 1.4), but it remains comfortably in second place.
The third-ranked measure is the gradual reduction in the number of public-sector employees, with a weighted score of 1.18. Its first-choice share (16.4%) is unchanged from last year, but it attracted the highest share of second-choice selections of any option (26.5%, up from 18.9%), which lifted its overall score. Under the weighted method used throughout this report, this measure has held third place in each of the last three surveys. Last year’s report, which ranked this question by the combined share of top-three mentions, placed it last; this year the two methods produce the same order, and the measure sits clearly ahead of the remaining two options.
Reducing spending on national projects (0.81) and rationalising assistance given to businesses (0.8) are effectively tied in fourth and fifth place. Fewer than one in ten respondents chose either as their first choice, but both appear frequently as a third choice (25.7% and 22.9%, respectively), suggesting they are seen as acceptable supplementary measures rather than first resorts.
A three-year view of deficit control suggestions, a stable hierarchy
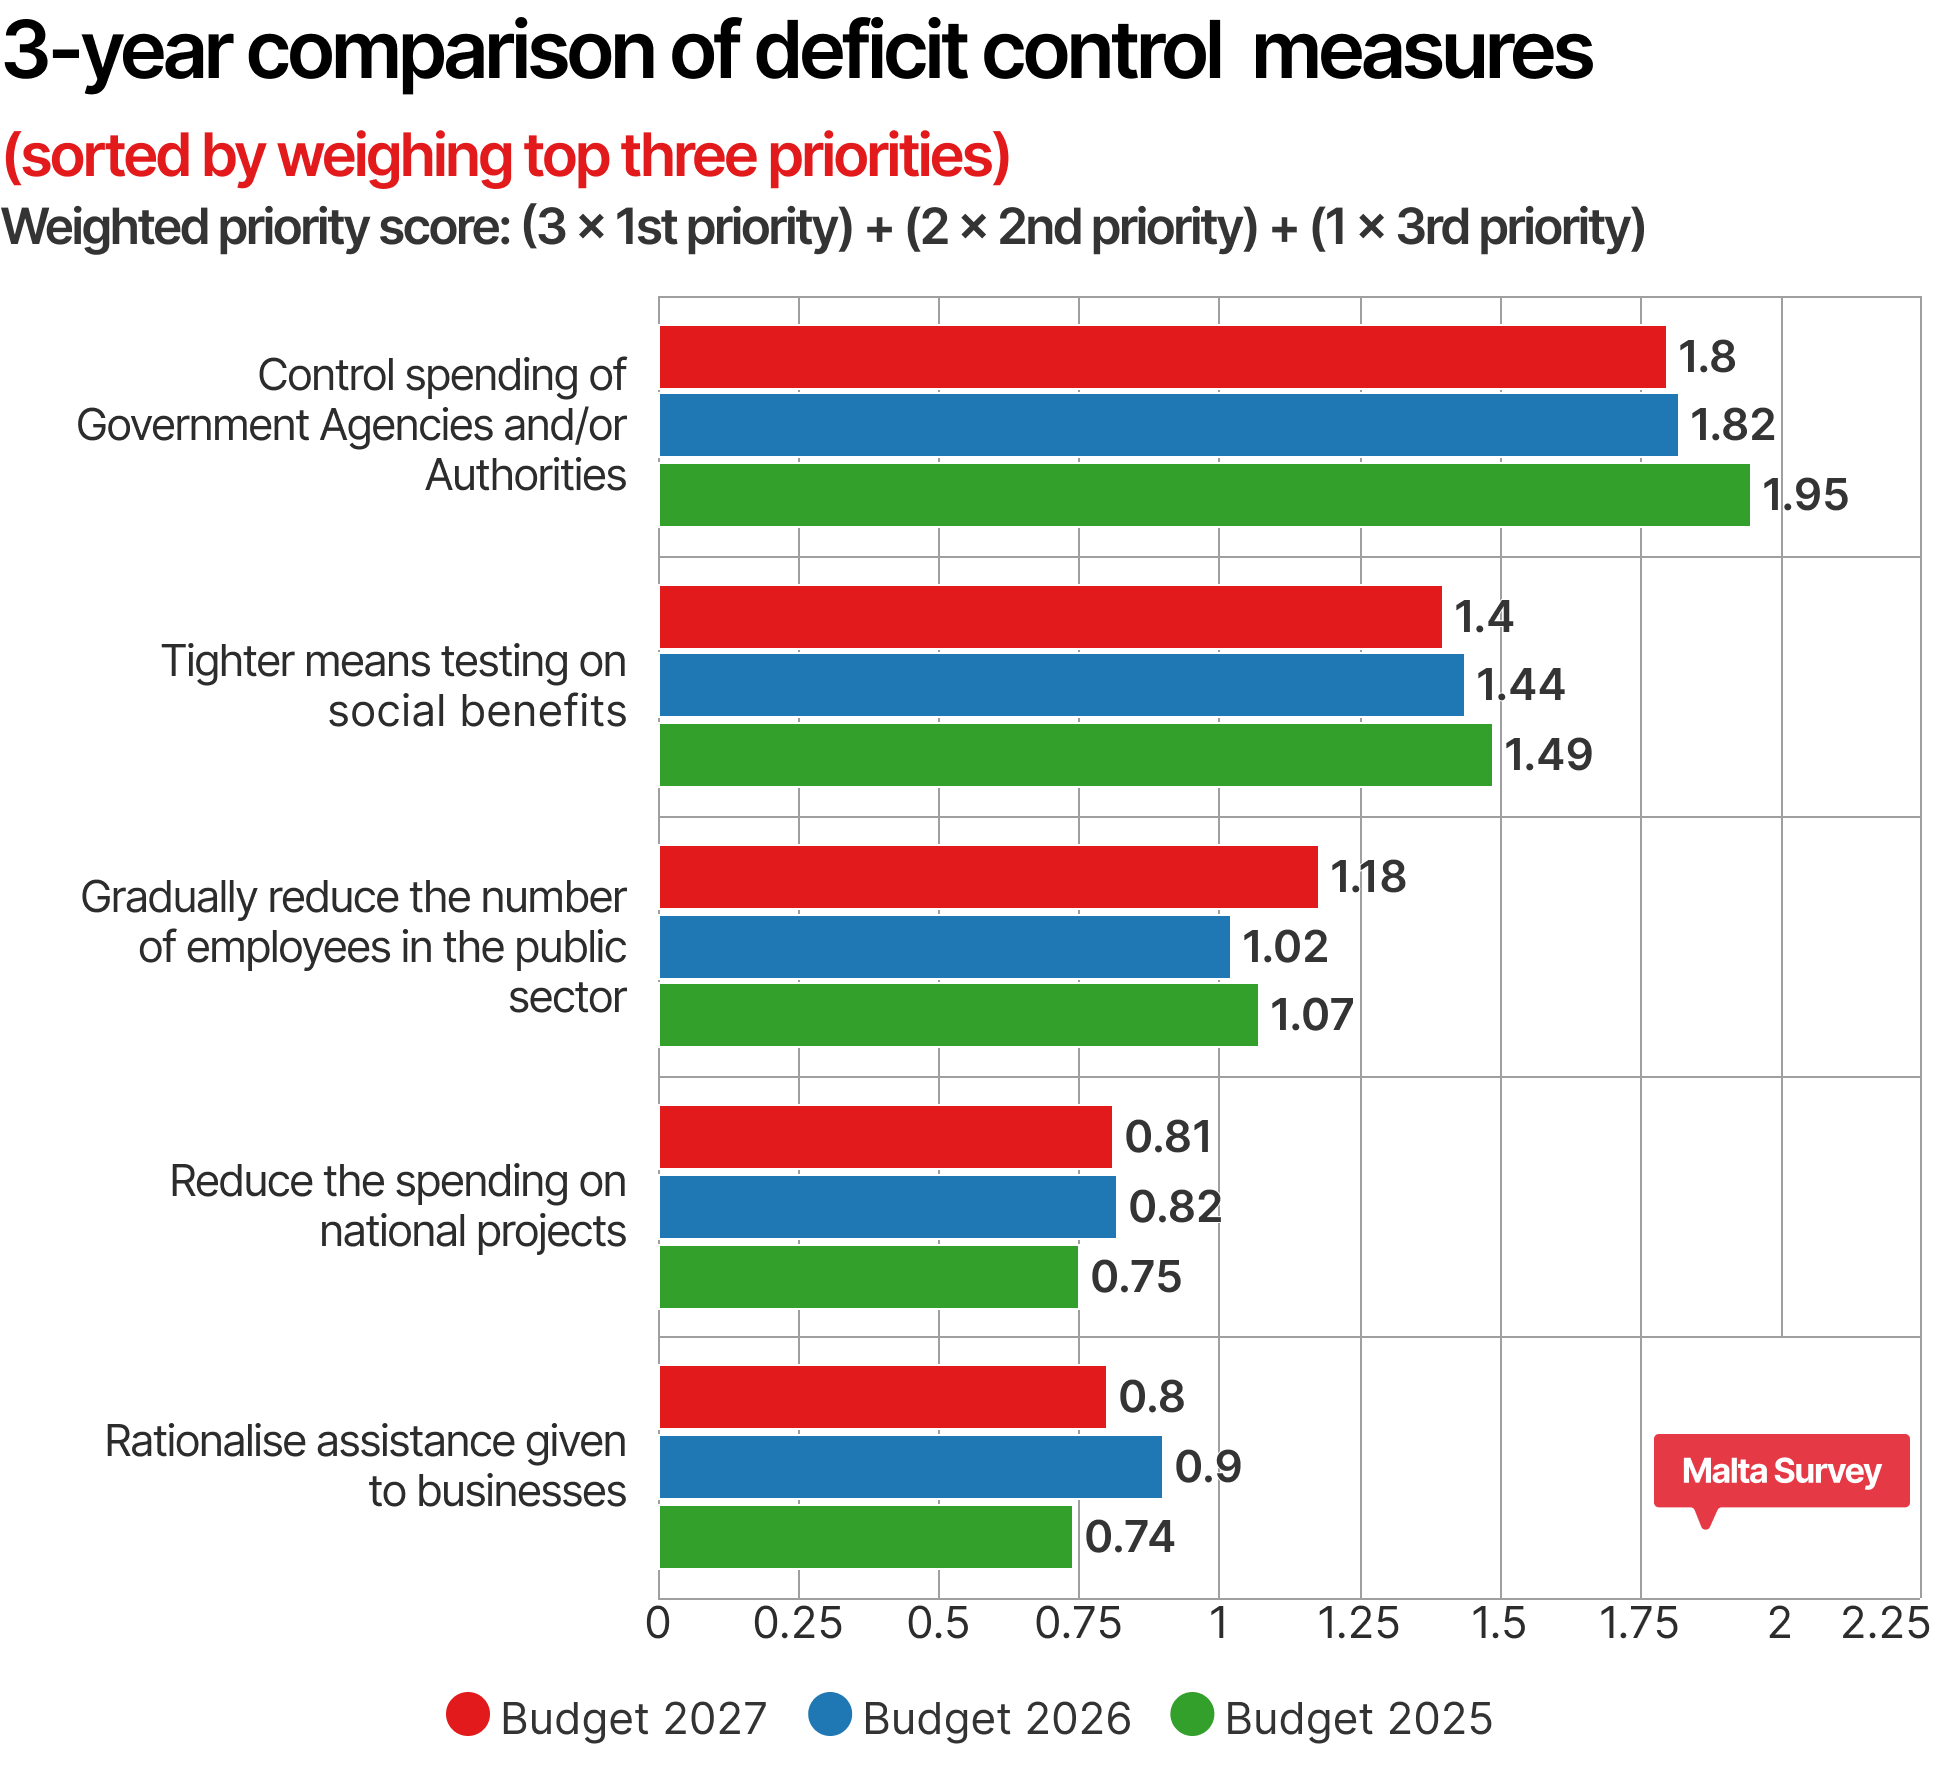
Of the three ranking questions in the survey, this is the one with the most stable results. The top two have not changed order across the three surveys, and the gap between them has barely moved. The one measure that has gained is the gradual reduction of public-sector headcount, whose score rose from 1.02 last year to 1.18 this year, its highest of the three years of this survey. Support for rationalising business assistance, which rose before Budget 2026, has fallen back towards its Budget 2025 level. In short, the public’s prescription for the deficit has been the same for three years: spending discipline within Government and better-targeted welfare, with headcount reduction as the third lever.
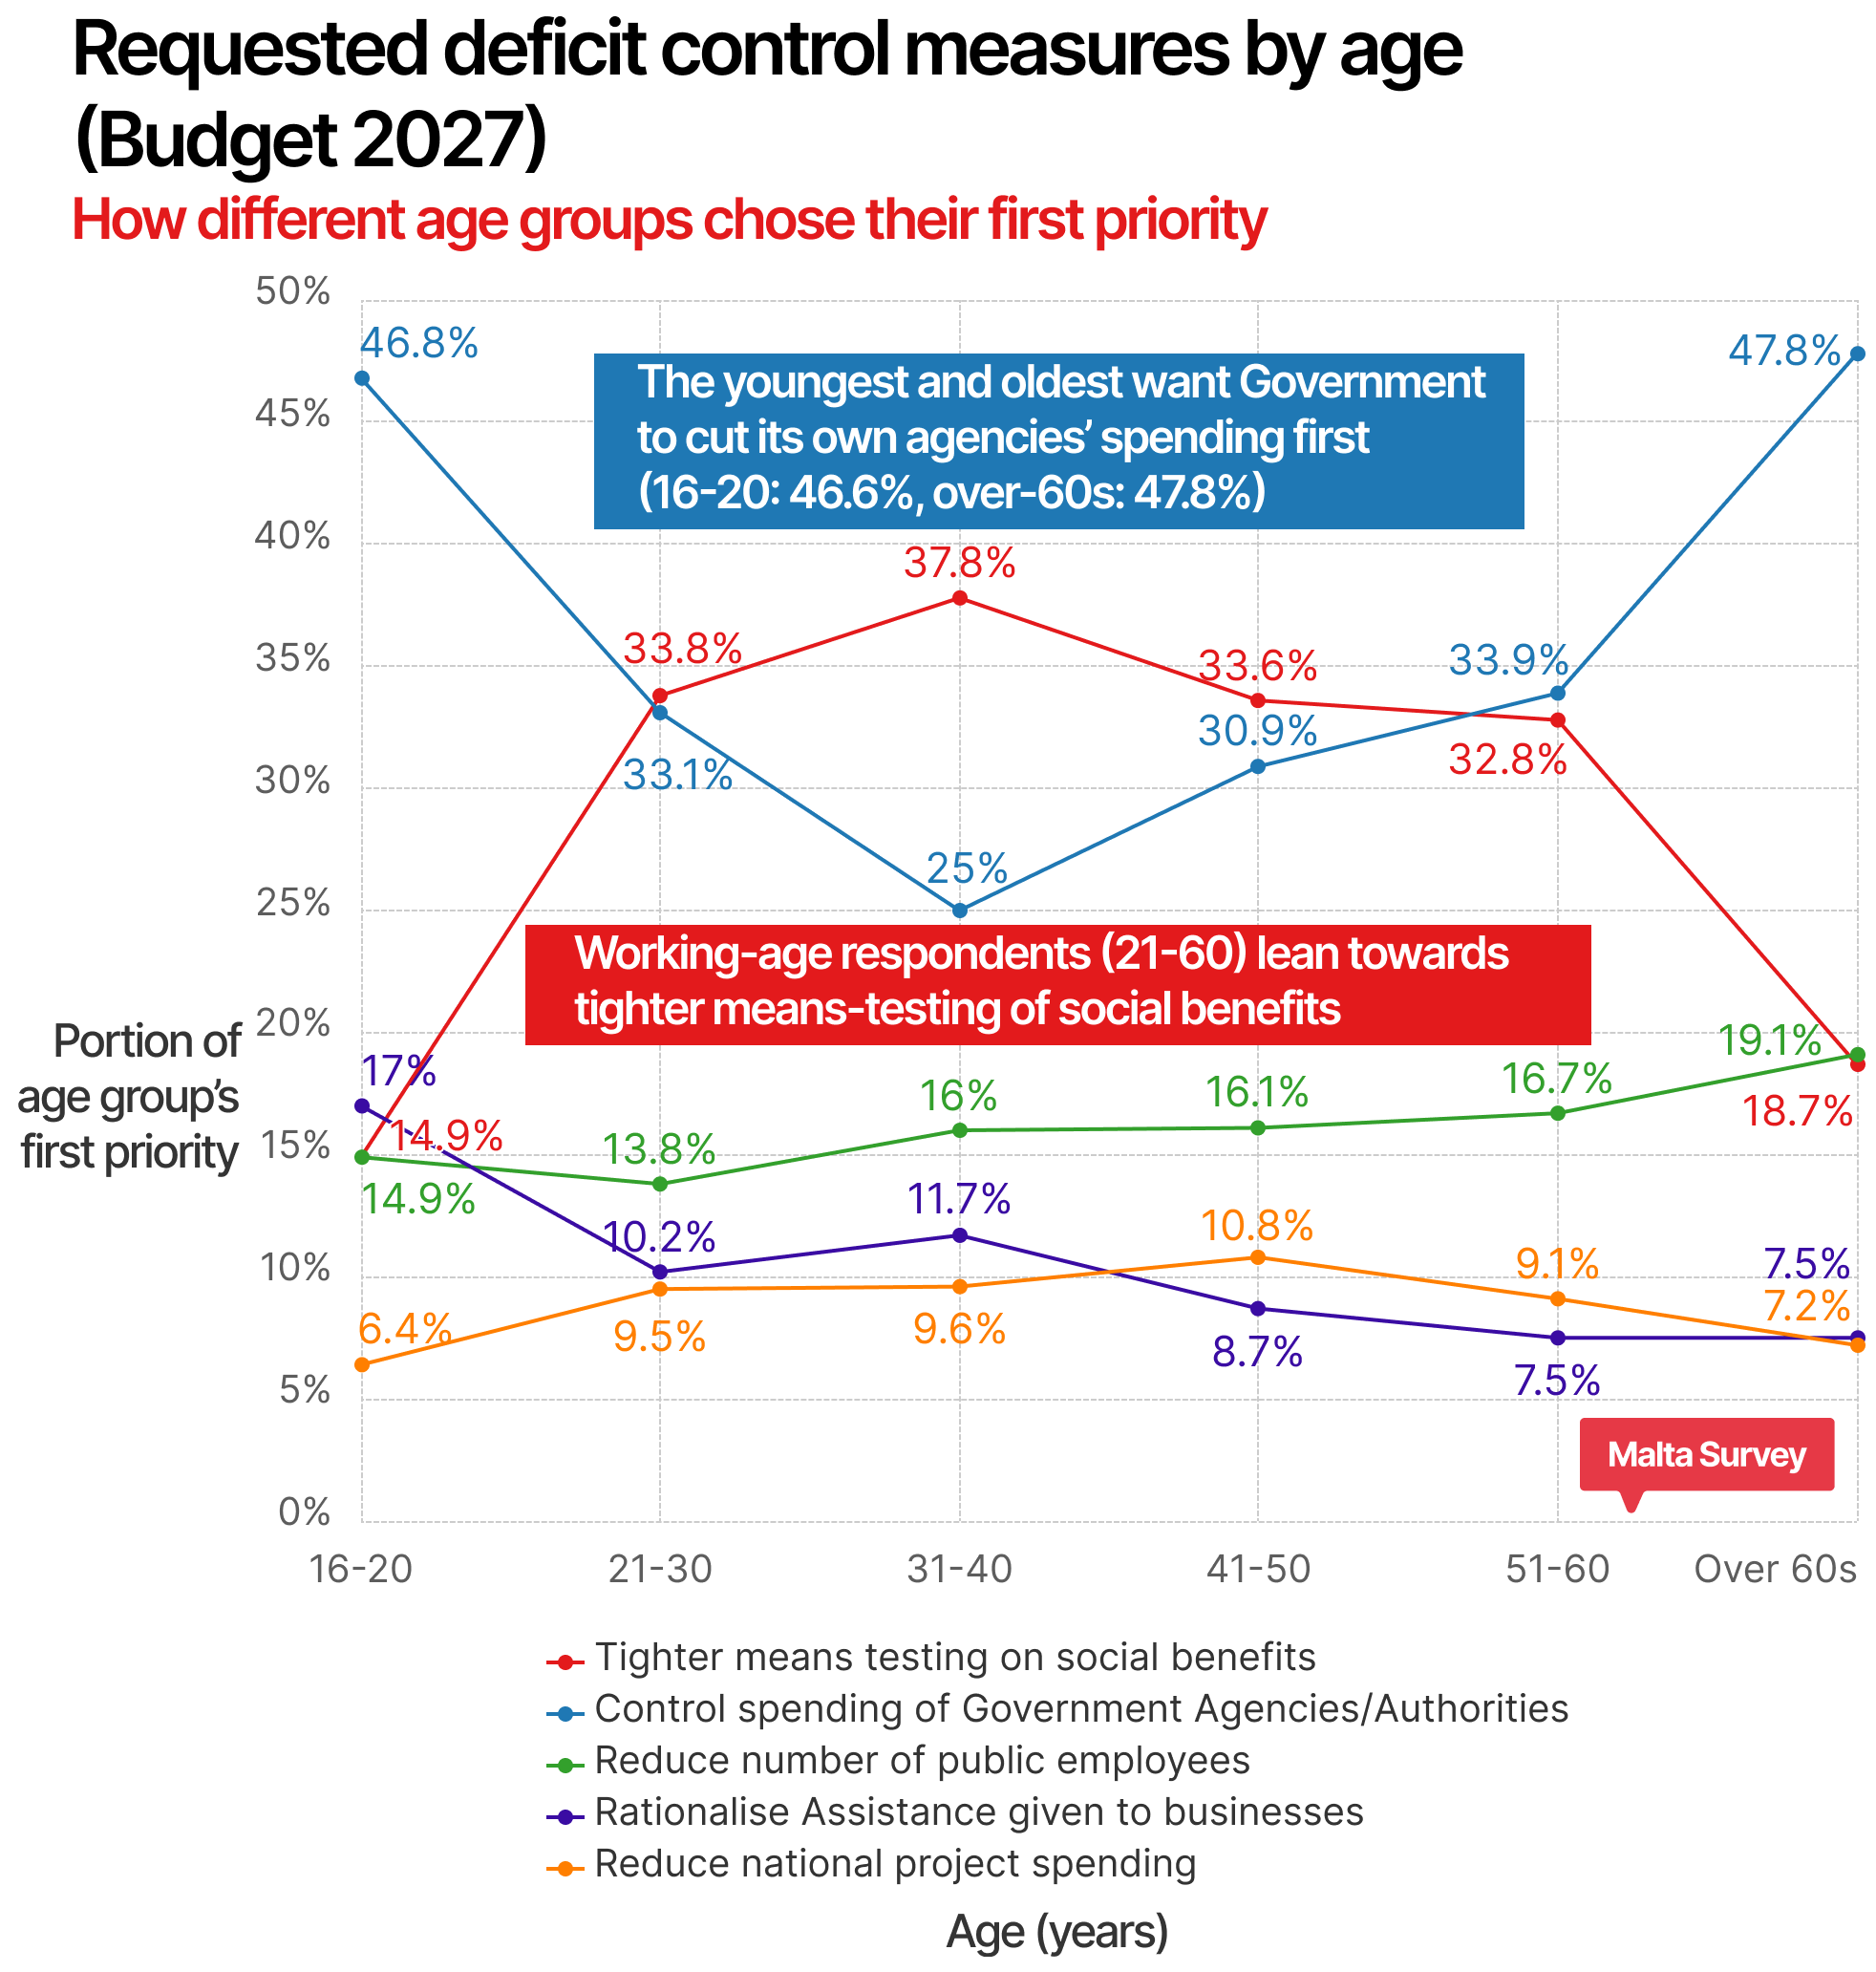
Sliced by age, the deficit question reveals a division that the overall ranking hides. Controlling spending by Government agencies and authorities is the first choice of 47.8% of the over-60s and 46.6% of 16-20-year-olds, but of only 25% to 34% of those aged 21 to 60. Tighter means-testing of social benefits is the mirror image: it is the first choice of 33% to 38% of working-age respondents (peaking at 37.7% among 31-40-year-olds) but of only 18.6% of the over-60s and 14.4% of 16-20-year-olds. The two lines cross twice, at 21-30 and again at 51-60. The reading is fairly plain: working-age taxpayers would rather see welfare targeted more tightly, while the groups most likely to be receiving benefits or allowances would rather the Government cut its own spending. Support for gradually reducing public-sector headcount is flat across the age range at 14% to 19%, rising slightly with age, and the two remaining options draw under 12% in every group. We once more remind the reader that sampled results have a margin of error, which operates differently in various smaller subsets of that sample.
Priority Economic Sectors for Budget 2027
The third ranking question asks where the money should go. Respondents chose and ordered three sectors from a list of ten: Health, Education, Environment, Infrastructure, Energy, Security, Social Services, Employment, Tourism and Research & Development.
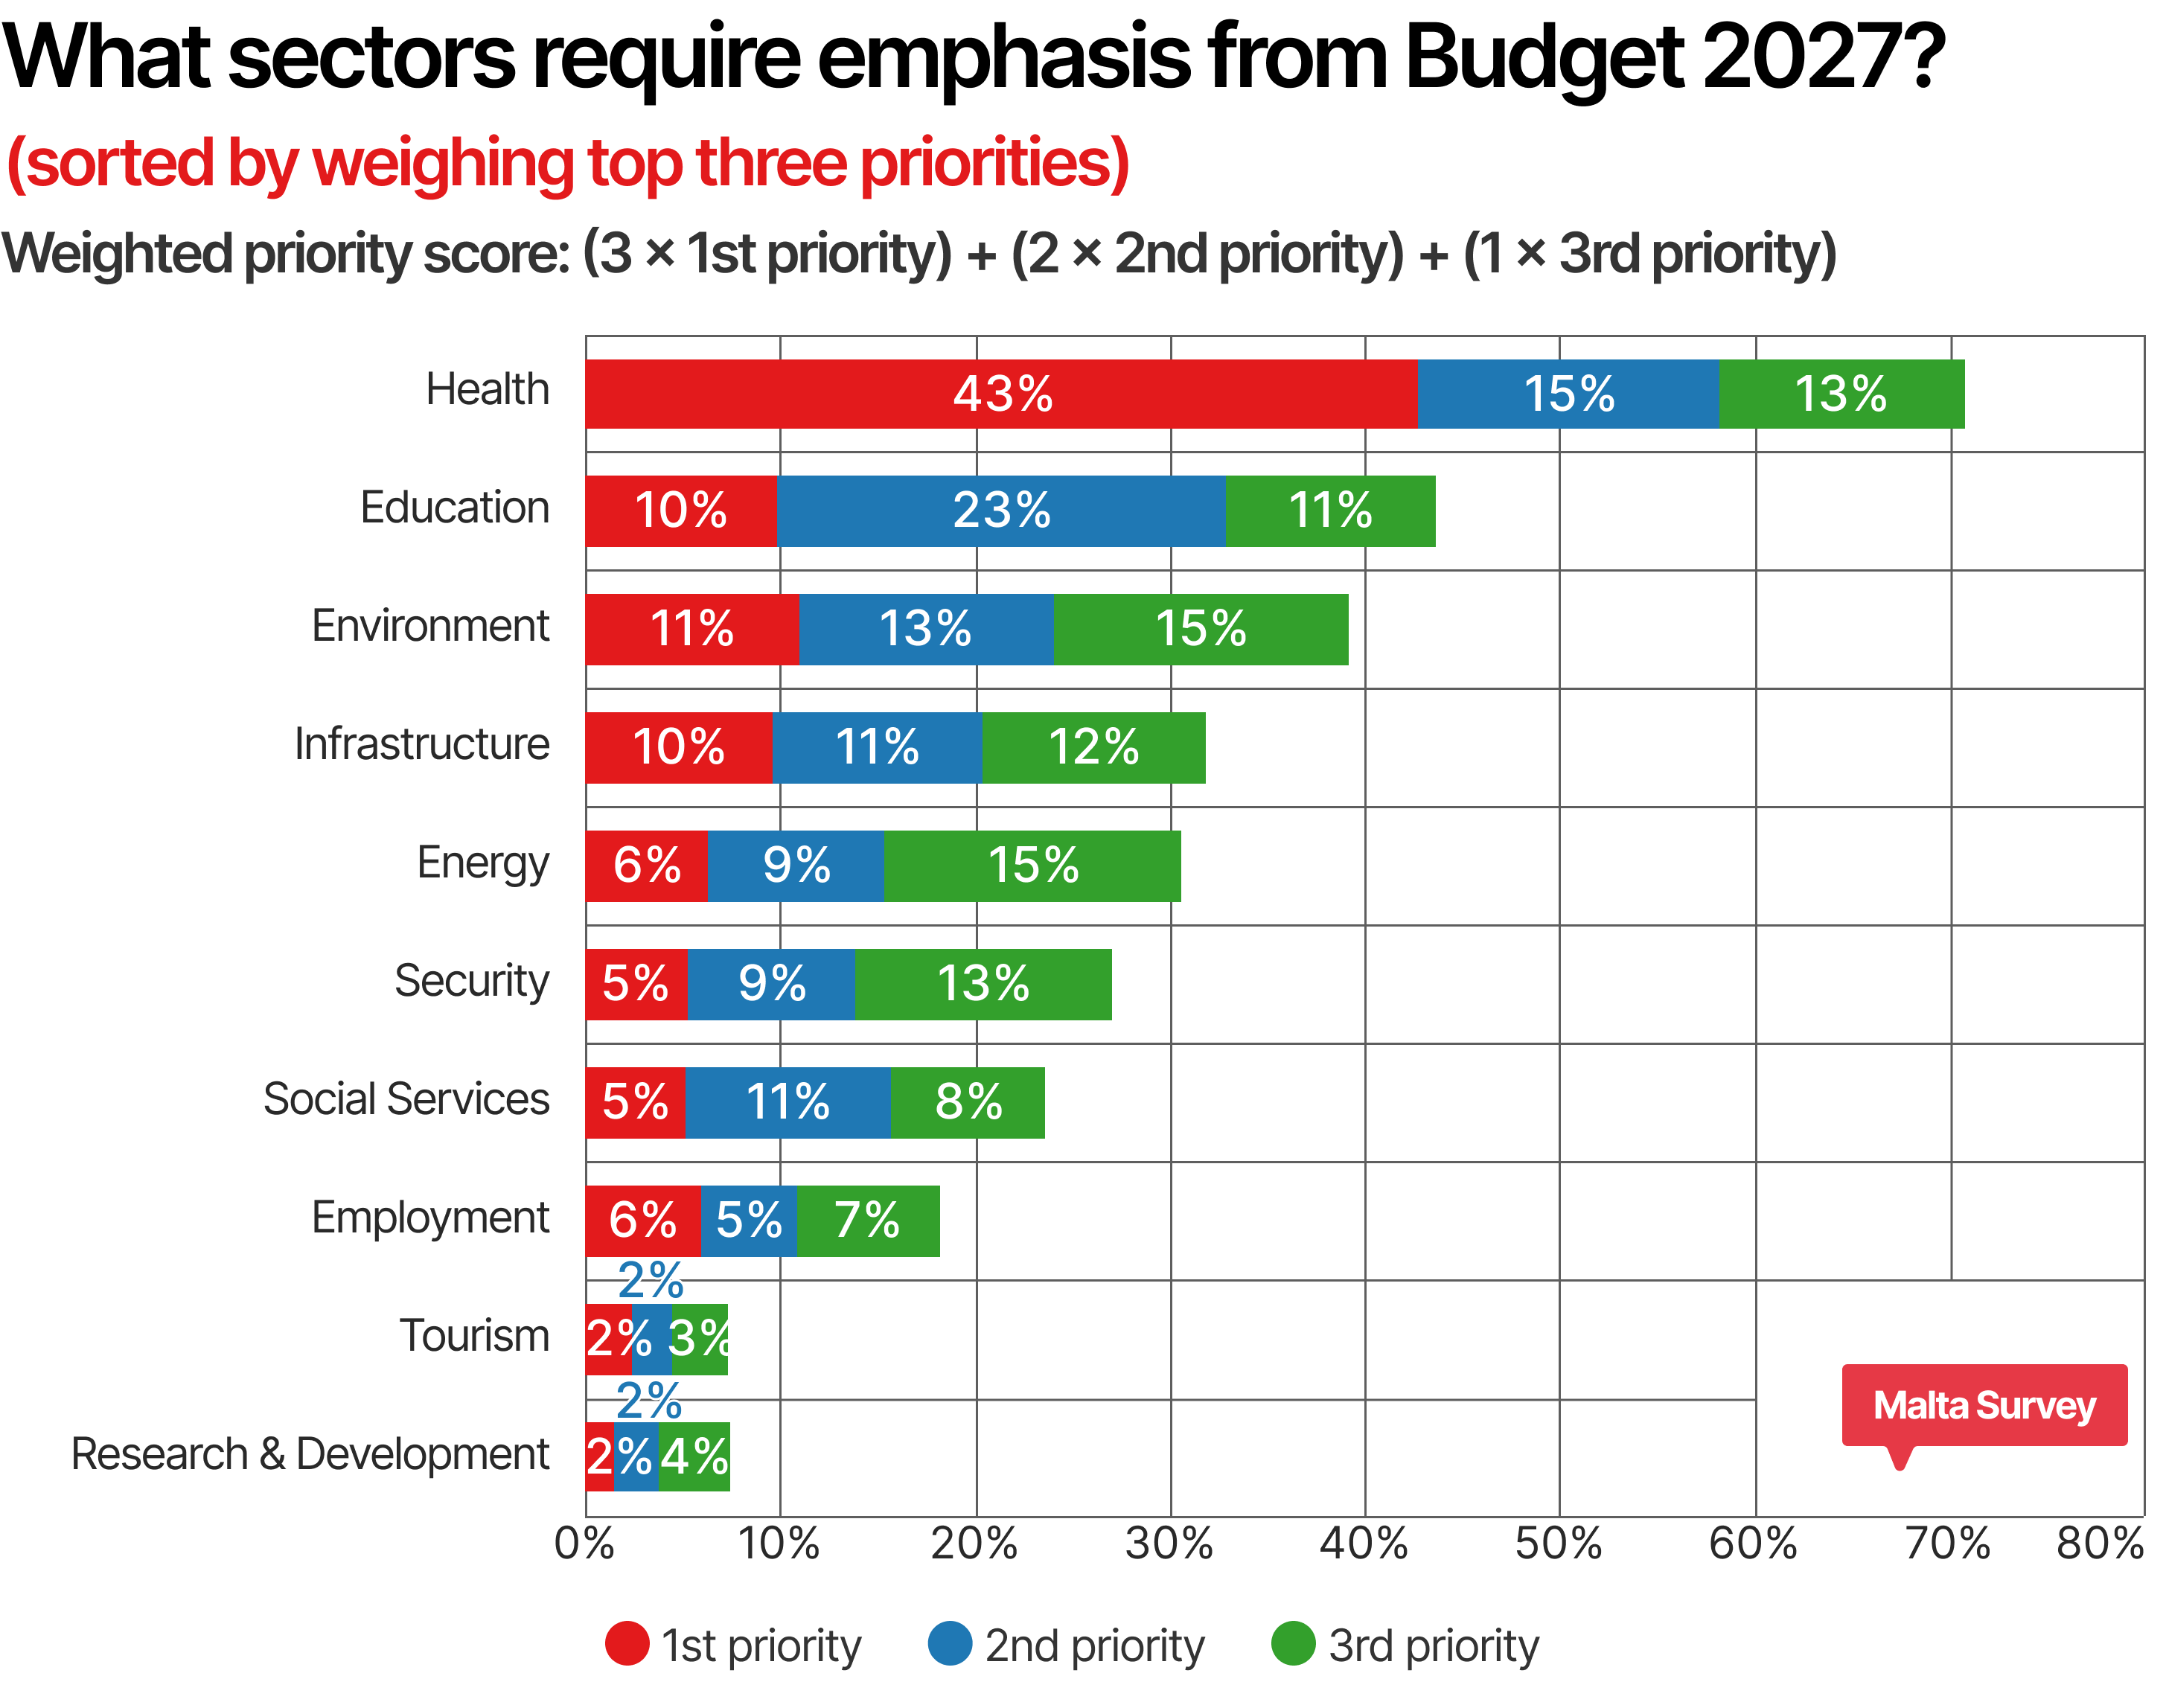
Health is in a category of its own. It is the first choice for 42.8% of respondents, the second for 15.4%, and the third for 12.6%, for a weighted score of 1.72, exactly double that of the next sector. No other edition of the survey has produced a different leader. Its first-choice share has eased slightly over three years (45.2%, 44.6%, 42.8%), a slow drift rather than a shift in opinion, and seven in ten respondents still put Health somewhere in their top three.
Education takes second place this year with a weighted score of 0.86. Its profile is the same as in every previous edition: few respondents put it first (9.9%), but it is the single most common second choice (23%). Its first-choice share has recovered from last year’s 7.5% to the level recorded before Budget 2026, and the combination of steady first-choice support and strong second-choice support is enough to lift it above Environment.
Environment drops to third place with a weighted score of 0.74. The fall is concentrated in first-choice support, which dropped from 18.6% last year to 11% this year, while second- and third-choice shares also eased. Before Budget 2025 and Budget 2026, Environment was a firm second, with scores of 0.98 and 1.04; this year’s figure is clearly the lowest of the three surveys. Health, Education and Environment remain the top three, as they have been in every recent pre-budget survey; only the order of second and third place has changed, along with the gap below Health.
Infrastructure holds fourth place and continues its gradual rise, with its weighted score improving from 0.48 to 0.56 to 0.62 over the three surveys and 9.5% of respondents now placing it first. The clearest movement in the lower half of the table is Energy, which has moved from eighth place in each of the previous two surveys to fifth this year. Its first-choice share rose from 2% to 6.4%, and 15.2% of respondents placed it third, the highest third-choice share of any sector. Its weighted score of 0.52 is two and a half times last year’s 0.21. Security (0.46) and Social Services (0.45) follow, with Social Services slipping from fifth to seventh. Employment, Tourism and Research & Development remain at the bottom of the list, as in previous years.
Three-year view: Energy enters the top five
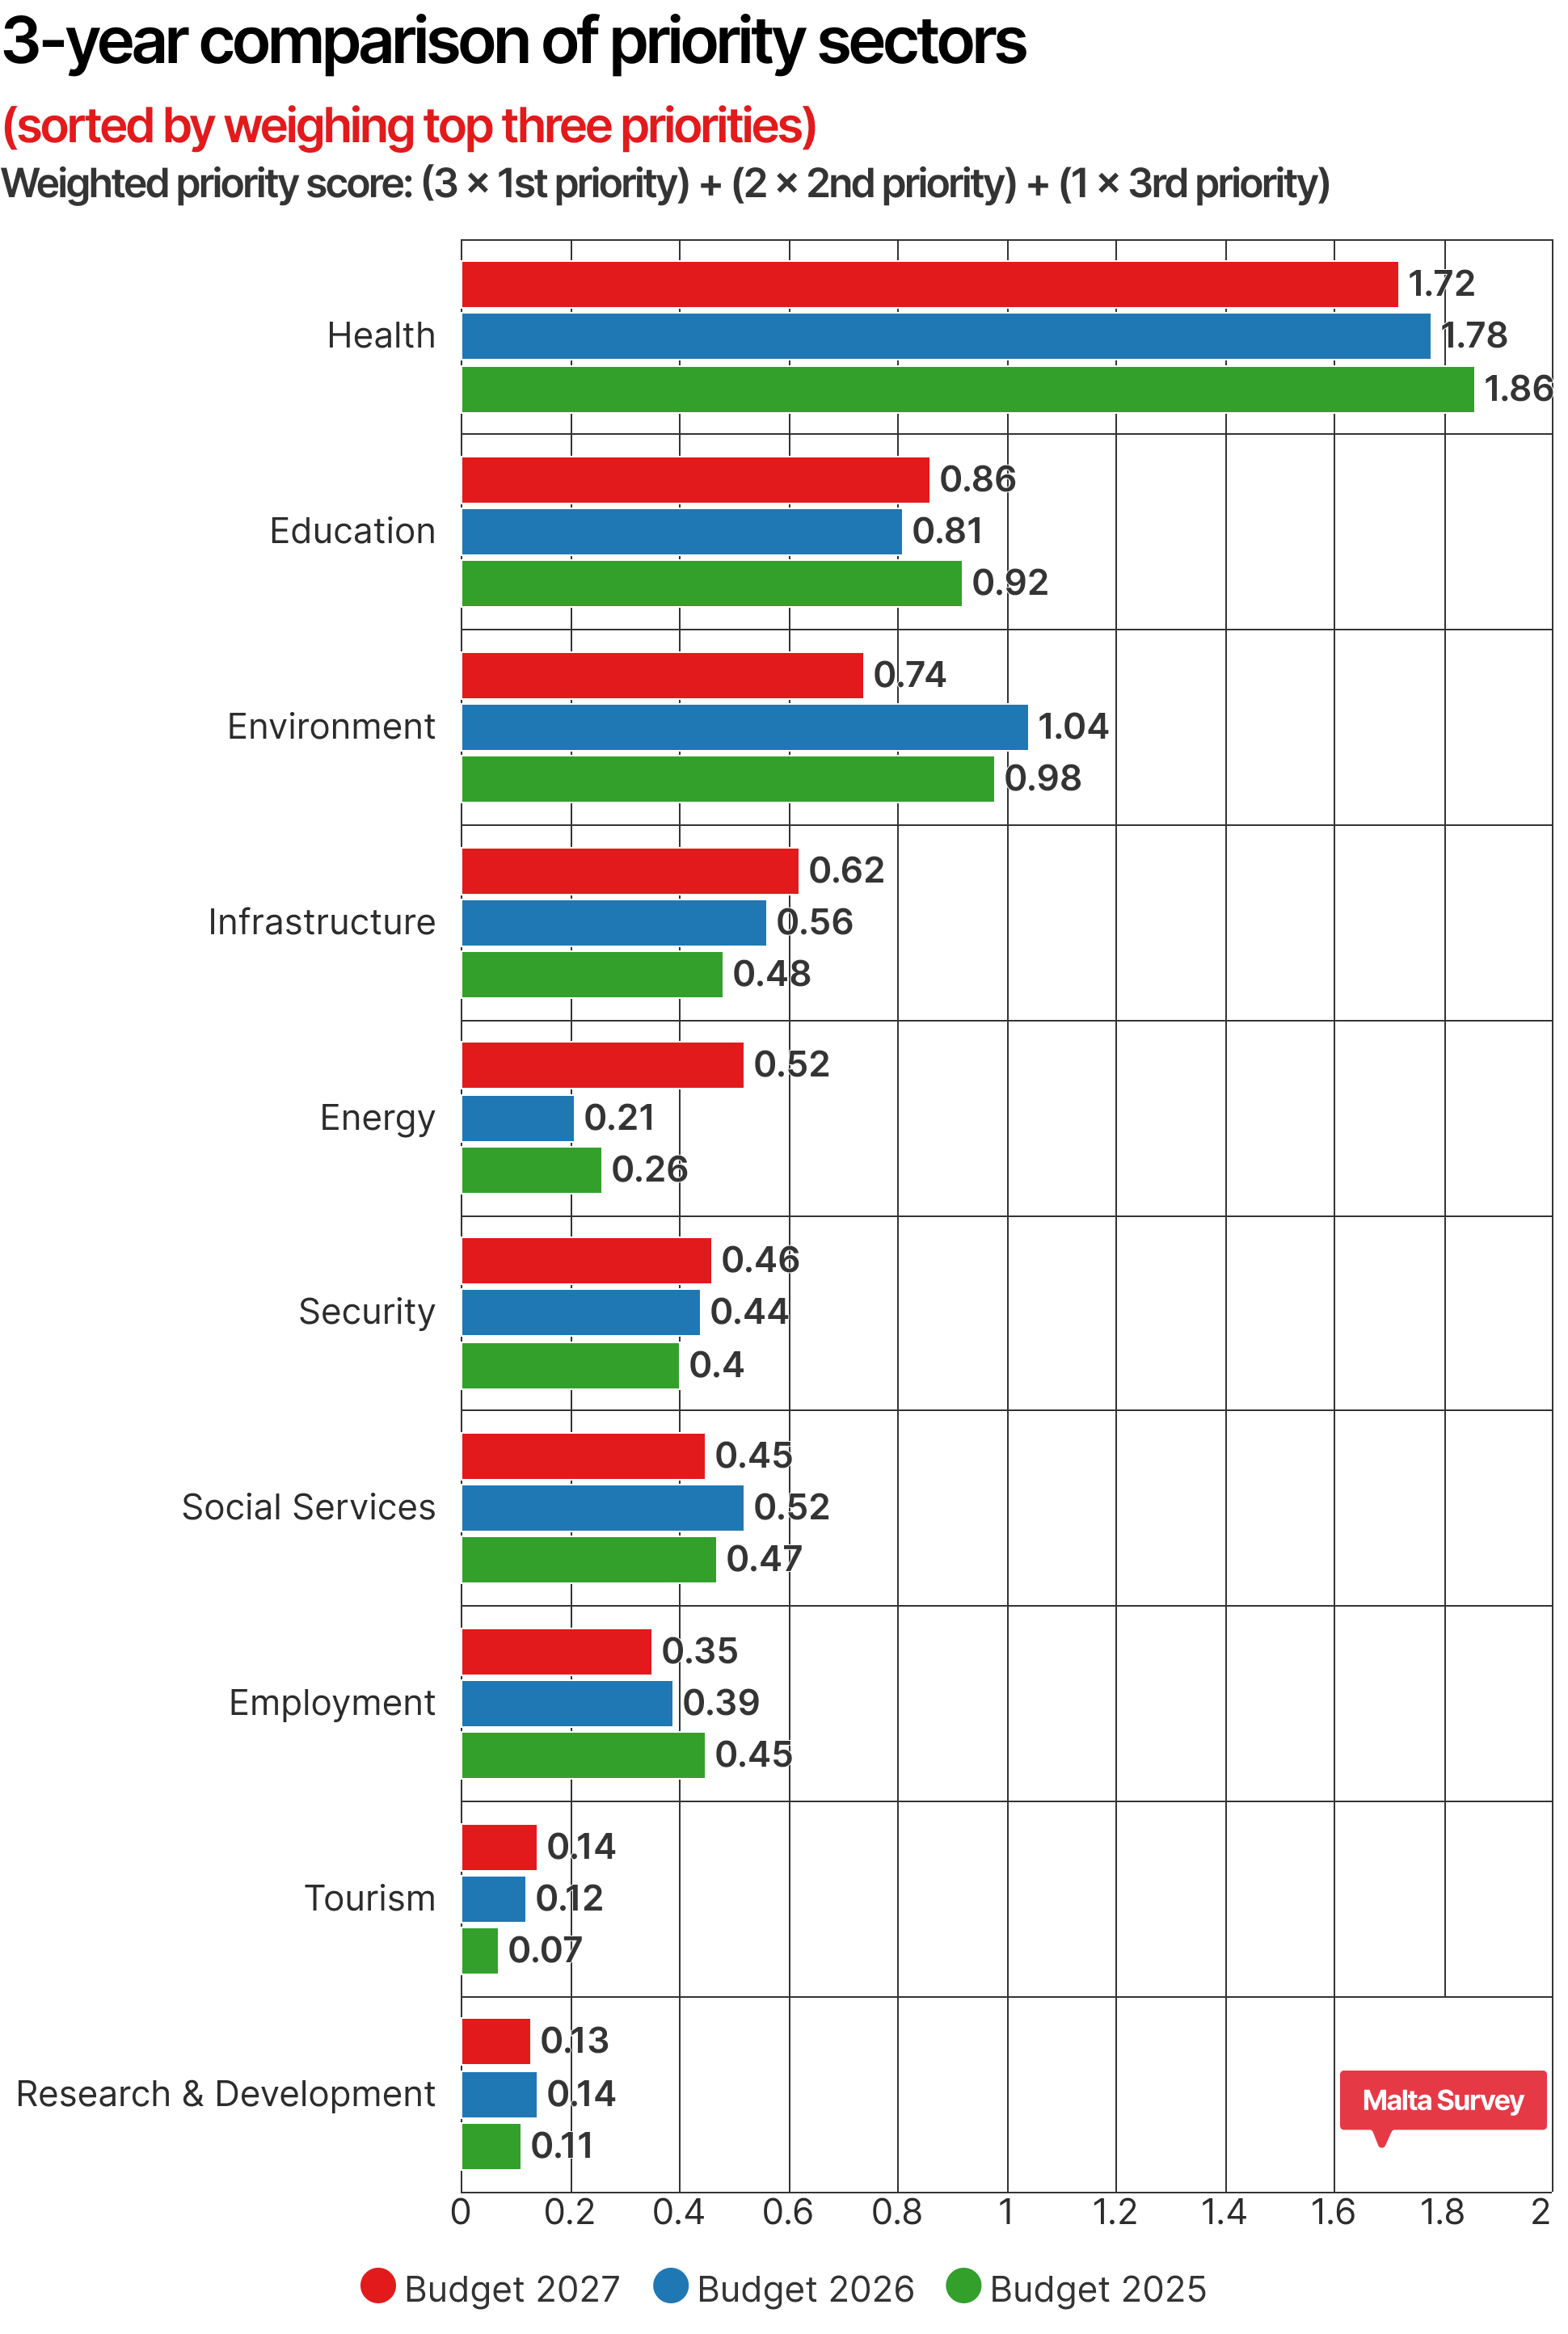
Over the three surveys, the top of the table has been stable, and the middle has moved. Health has held first place throughout with a slowly declining score. Environment’s fall and Energy’s rise stand out. The Budget 2027 survey was run at a time when keeping energy and fuel prices stable has been a prominent part of the national debate, with Government committing to maintain its energy subsidies amid an uncertain international environment. The results suggest this has resonated with the public: energy is now seen as an area that needs budgetary attention in its own right, rather than something to take for granted.
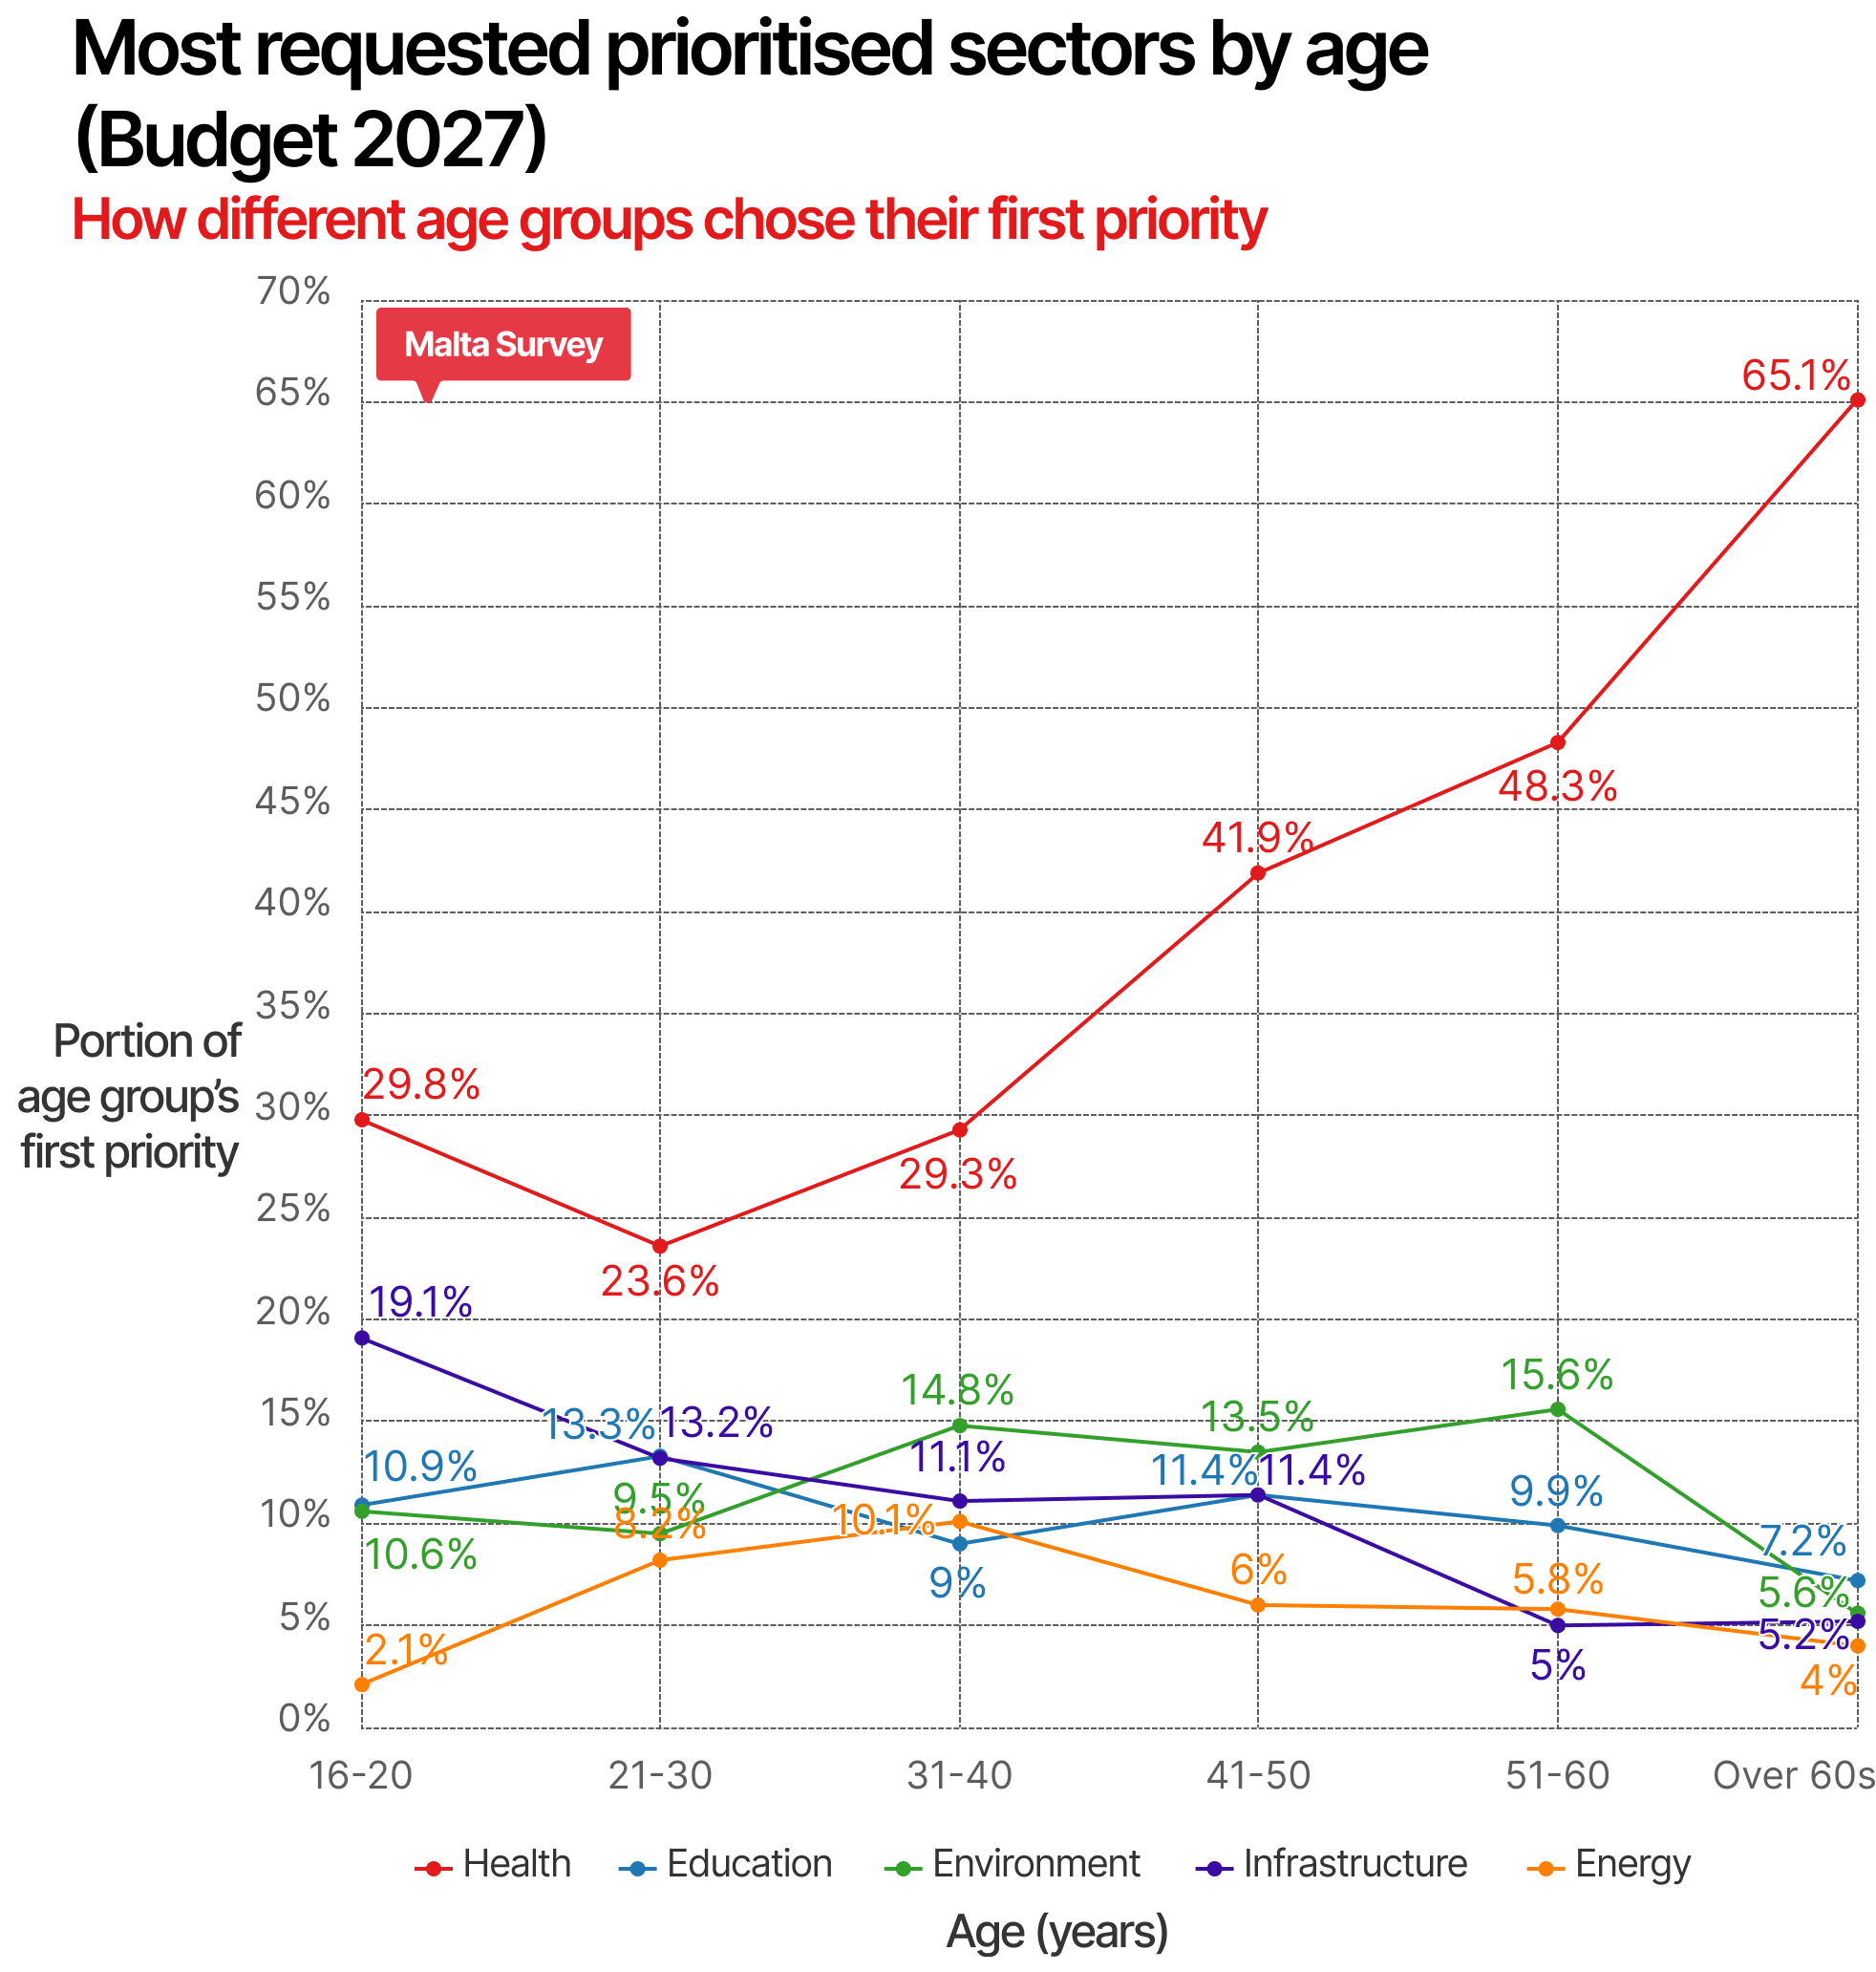
The age breakdown shows that Health’s dominance grows with age: 65.1% of the over-60s put Health first (up from 58.2% last year), compared with 23.6% of 21-30-year-olds, among whom priorities are far more spread out. Infrastructure is a notable first choice among the youngest respondents (19.1% of 16-20-year-olds). Education draws its strongest first-choice support from the 21-30 group (13.3%).
Support for Environment drops in every age group, but it falls fastest at the two ends of the age range. Among 21-30-year-olds, the share putting Environment first fell from 26% to 9.5%, and among the over-60s from 14.5% to 5.6%. Last year, Environment was the second-placed first choice for 21-30-year-olds, well ahead of Education and Infrastructure; this year it sits behind both. It would be premature to read this as a loss of interest in the environment as such. More likely, with housing costs and economic confidence weighing more heavily, younger respondents in particular have moved environmental spending down their list of immediate budget demands.
Budget 2027 Expectations Sentiment
The final question moves from what people want to whether they expect to get it. Respondents were asked how confident they are that Budget 2027 will meet their expectations, on a five-point scale running from Highly Confident through Somewhat Confident and I’m not sure to Not that Confident and Not at all Confident.
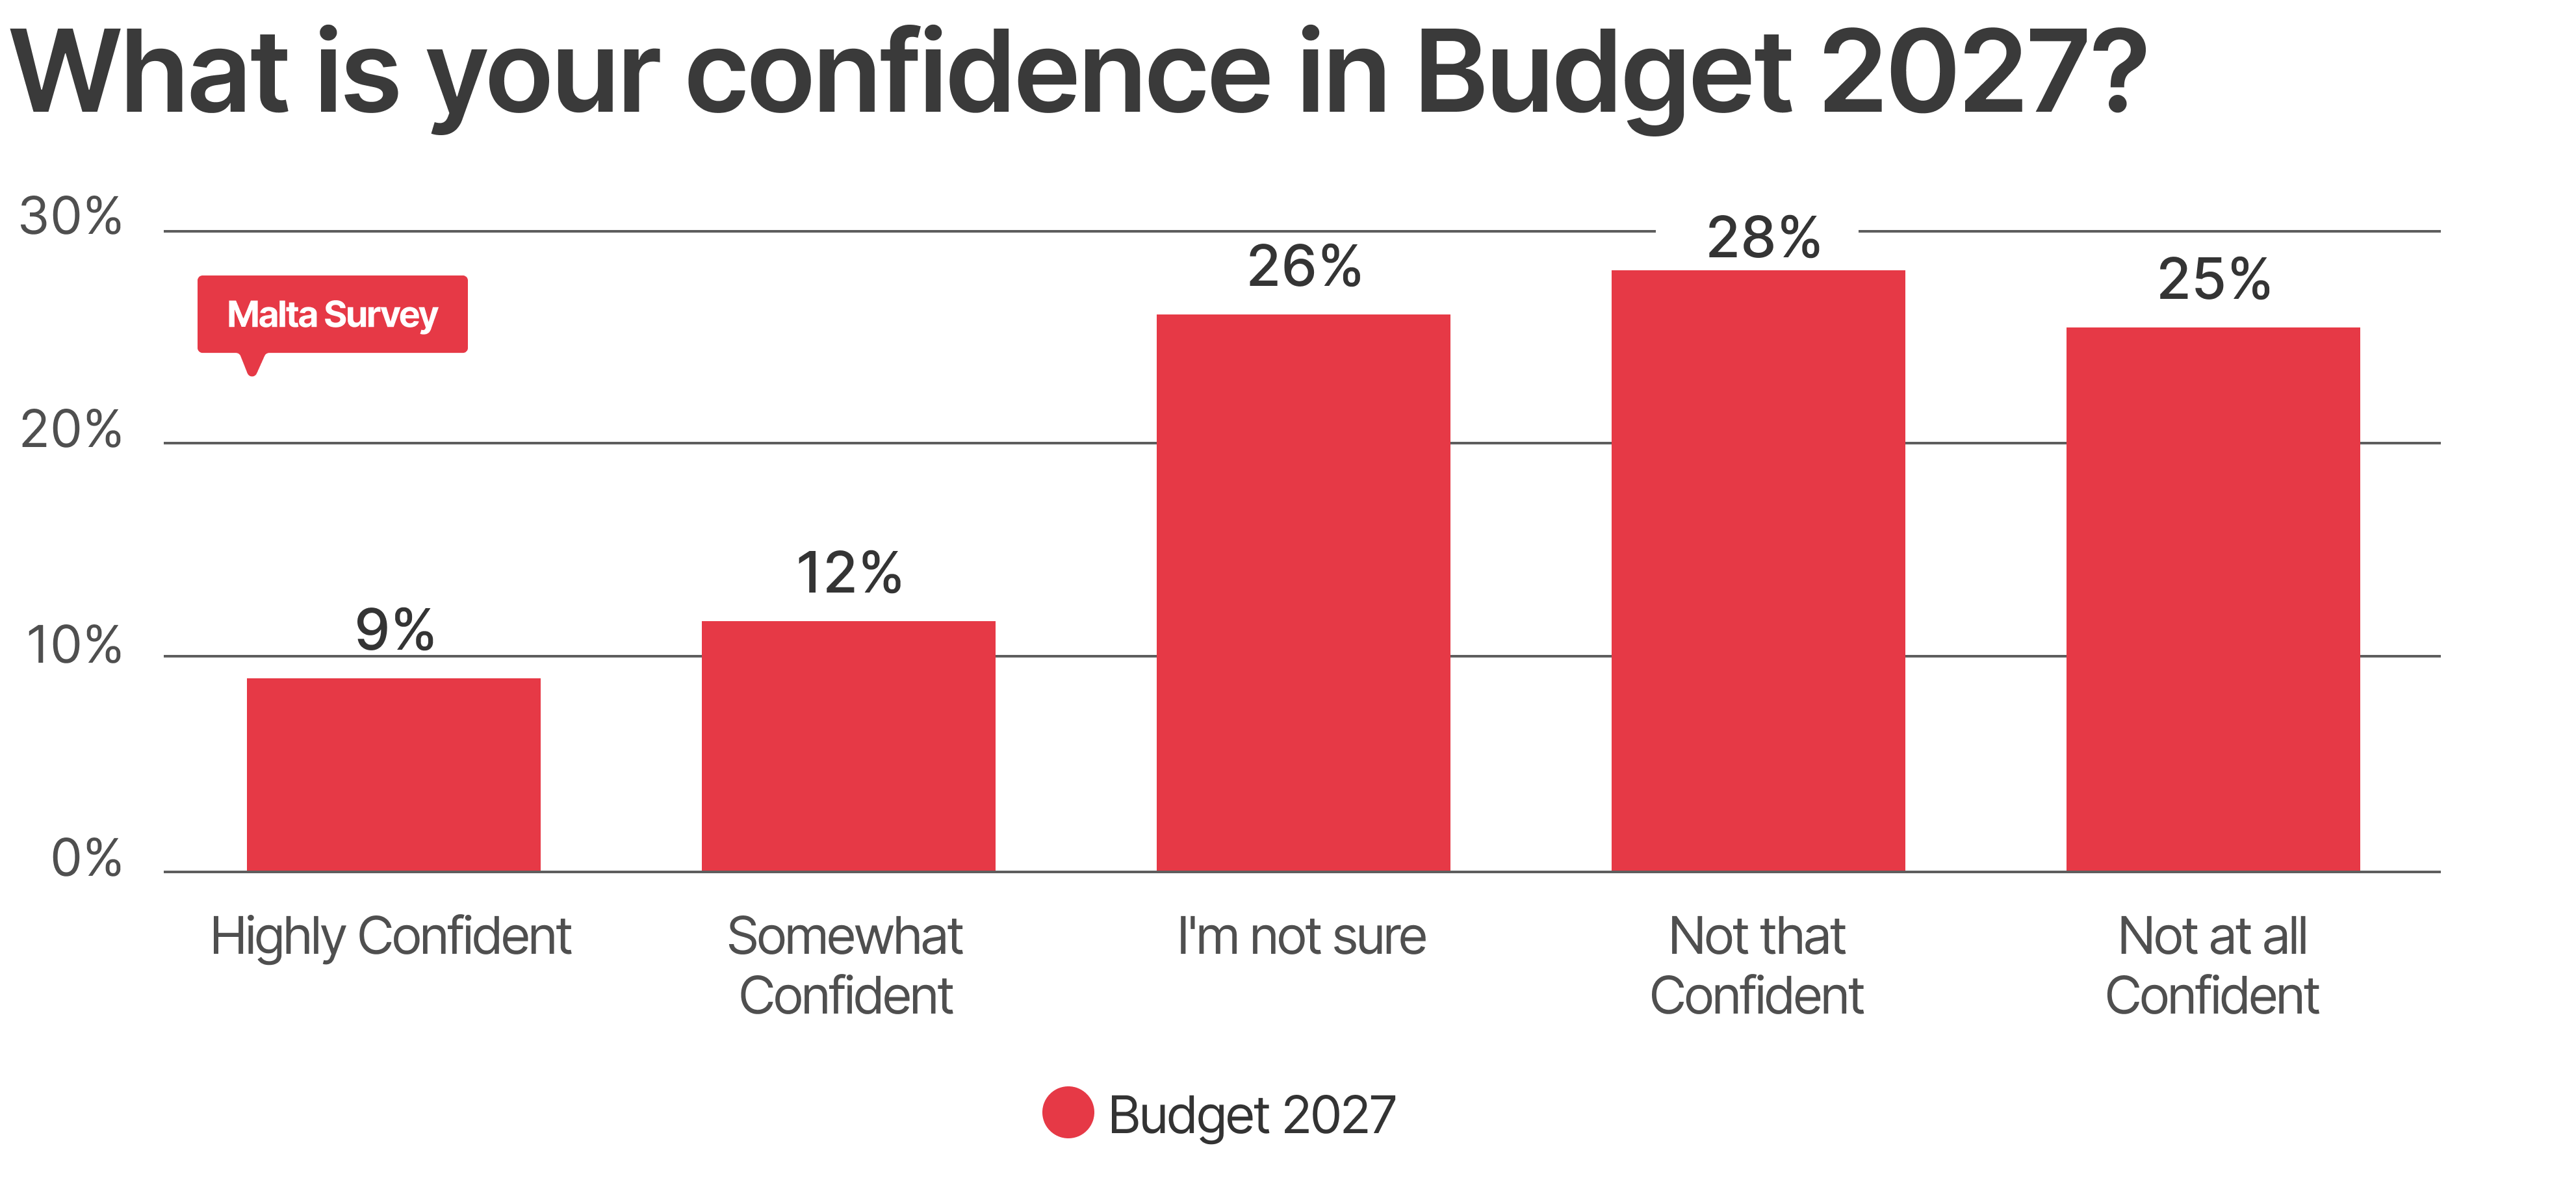
The mood is more doubtful than it was twelve months ago. The single most common answer is “Not that Confident” (28%), with “I’m not sure” (26%) and “Not at all Confident” (25.4%) close behind. Combined, the two negative responses total 53.4%, meaning respondents do not expect Budget 2027 to meet their expectations. One in five (20.6%) does, split between 9% who are highly confident and 11.6% who are somewhat confident, and the remaining quarter has not made up its mind.
Three-year view of pre-budget confidence
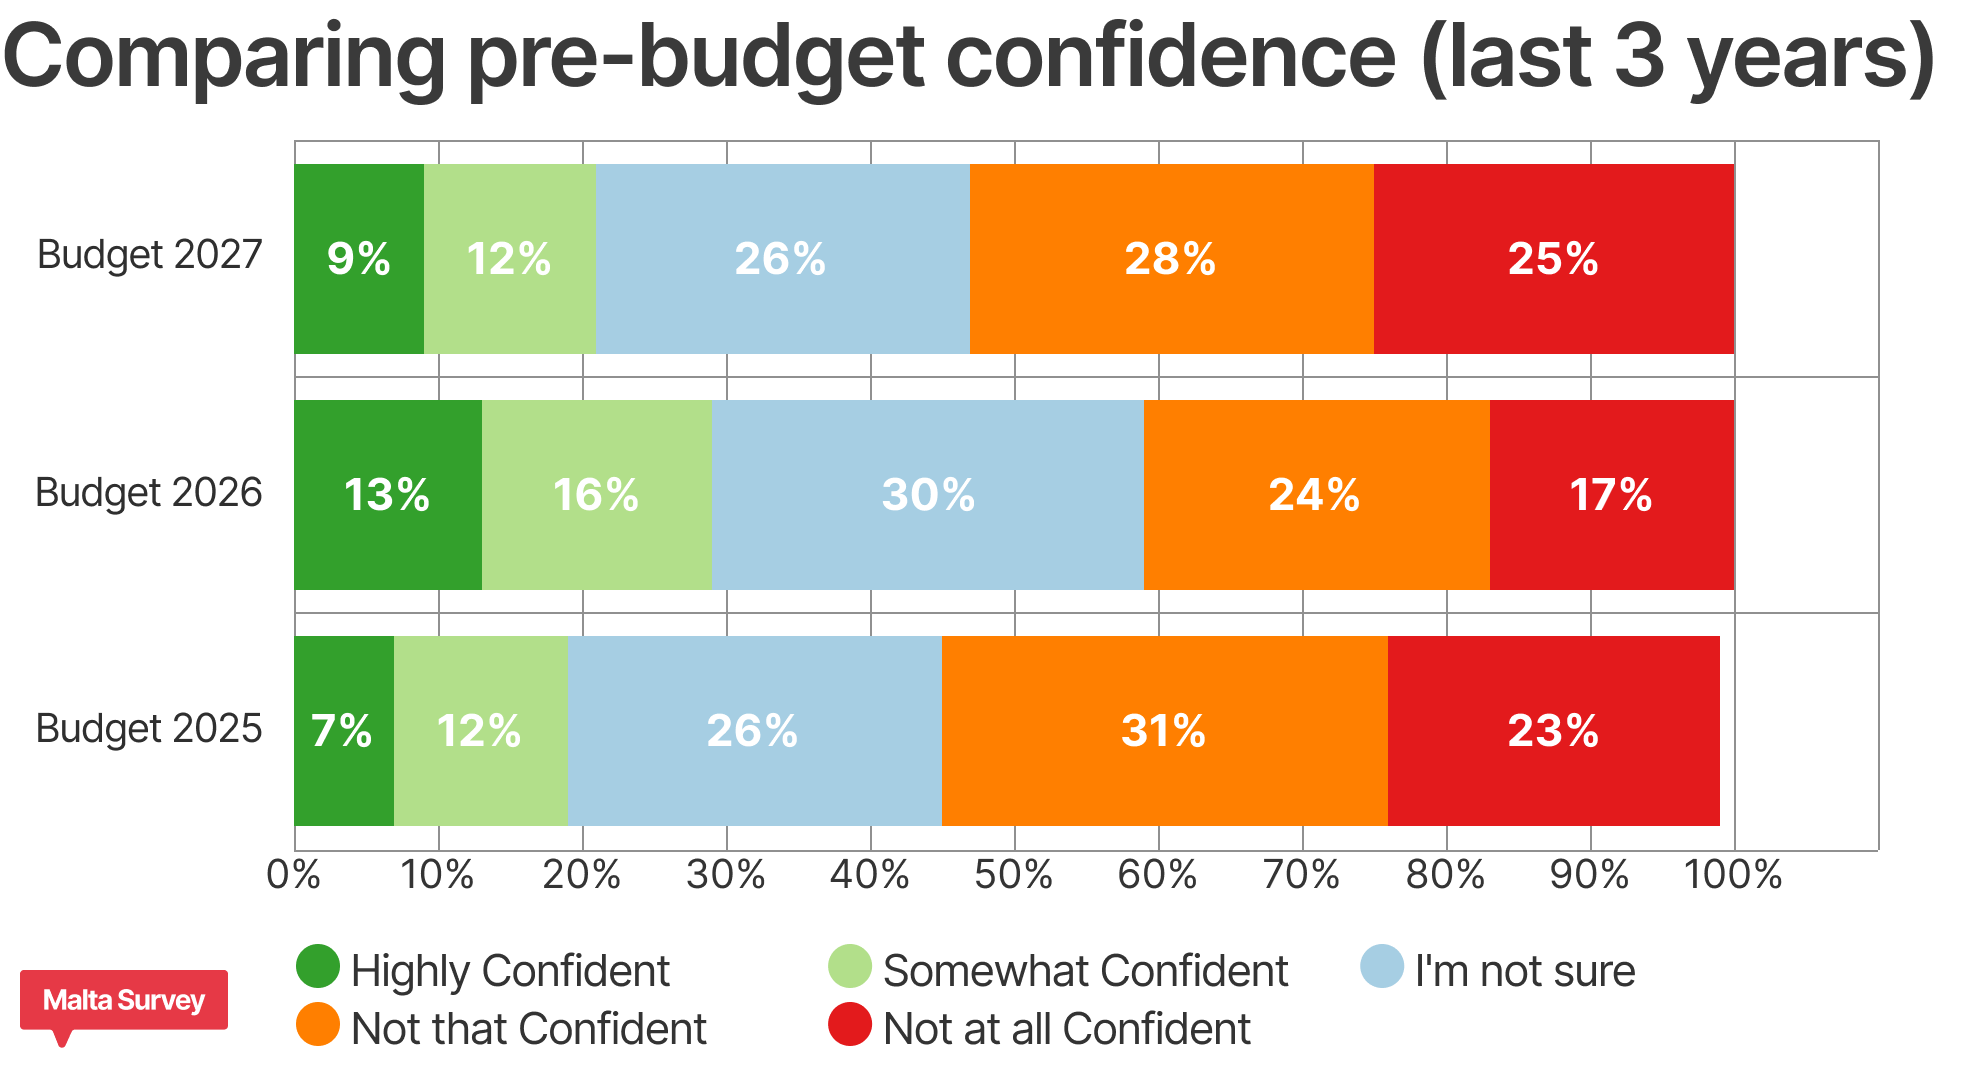
Set against the two previous editions, the result is a return to form rather than a new low. The Budget 2026 survey recorded the most optimistic reading in the series: 28.7% confident, 30.3% unsure and 41.1% not confident. Every one of those gains has now reversed. The share that is highly confident has fallen from 13.2% to 9%, somewhat confident from 15.5% to 11.6%, and the share that is not at all confident has risen from 16.6% to 25.4%, its highest level in the last three years. The undecided share has also shrunk from 30.3% to 26%, and the movement has gone almost entirely to the sceptical side.
One caution is in order: the survey measures confidence that the budget will meet expectations, and expectations have themselves shifted towards housing, an area where last year’s budget offered help to buyers but no mechanism to restrain prices. Some of the fall in confidence may reflect that gap.
Pre-Budget confidence by age
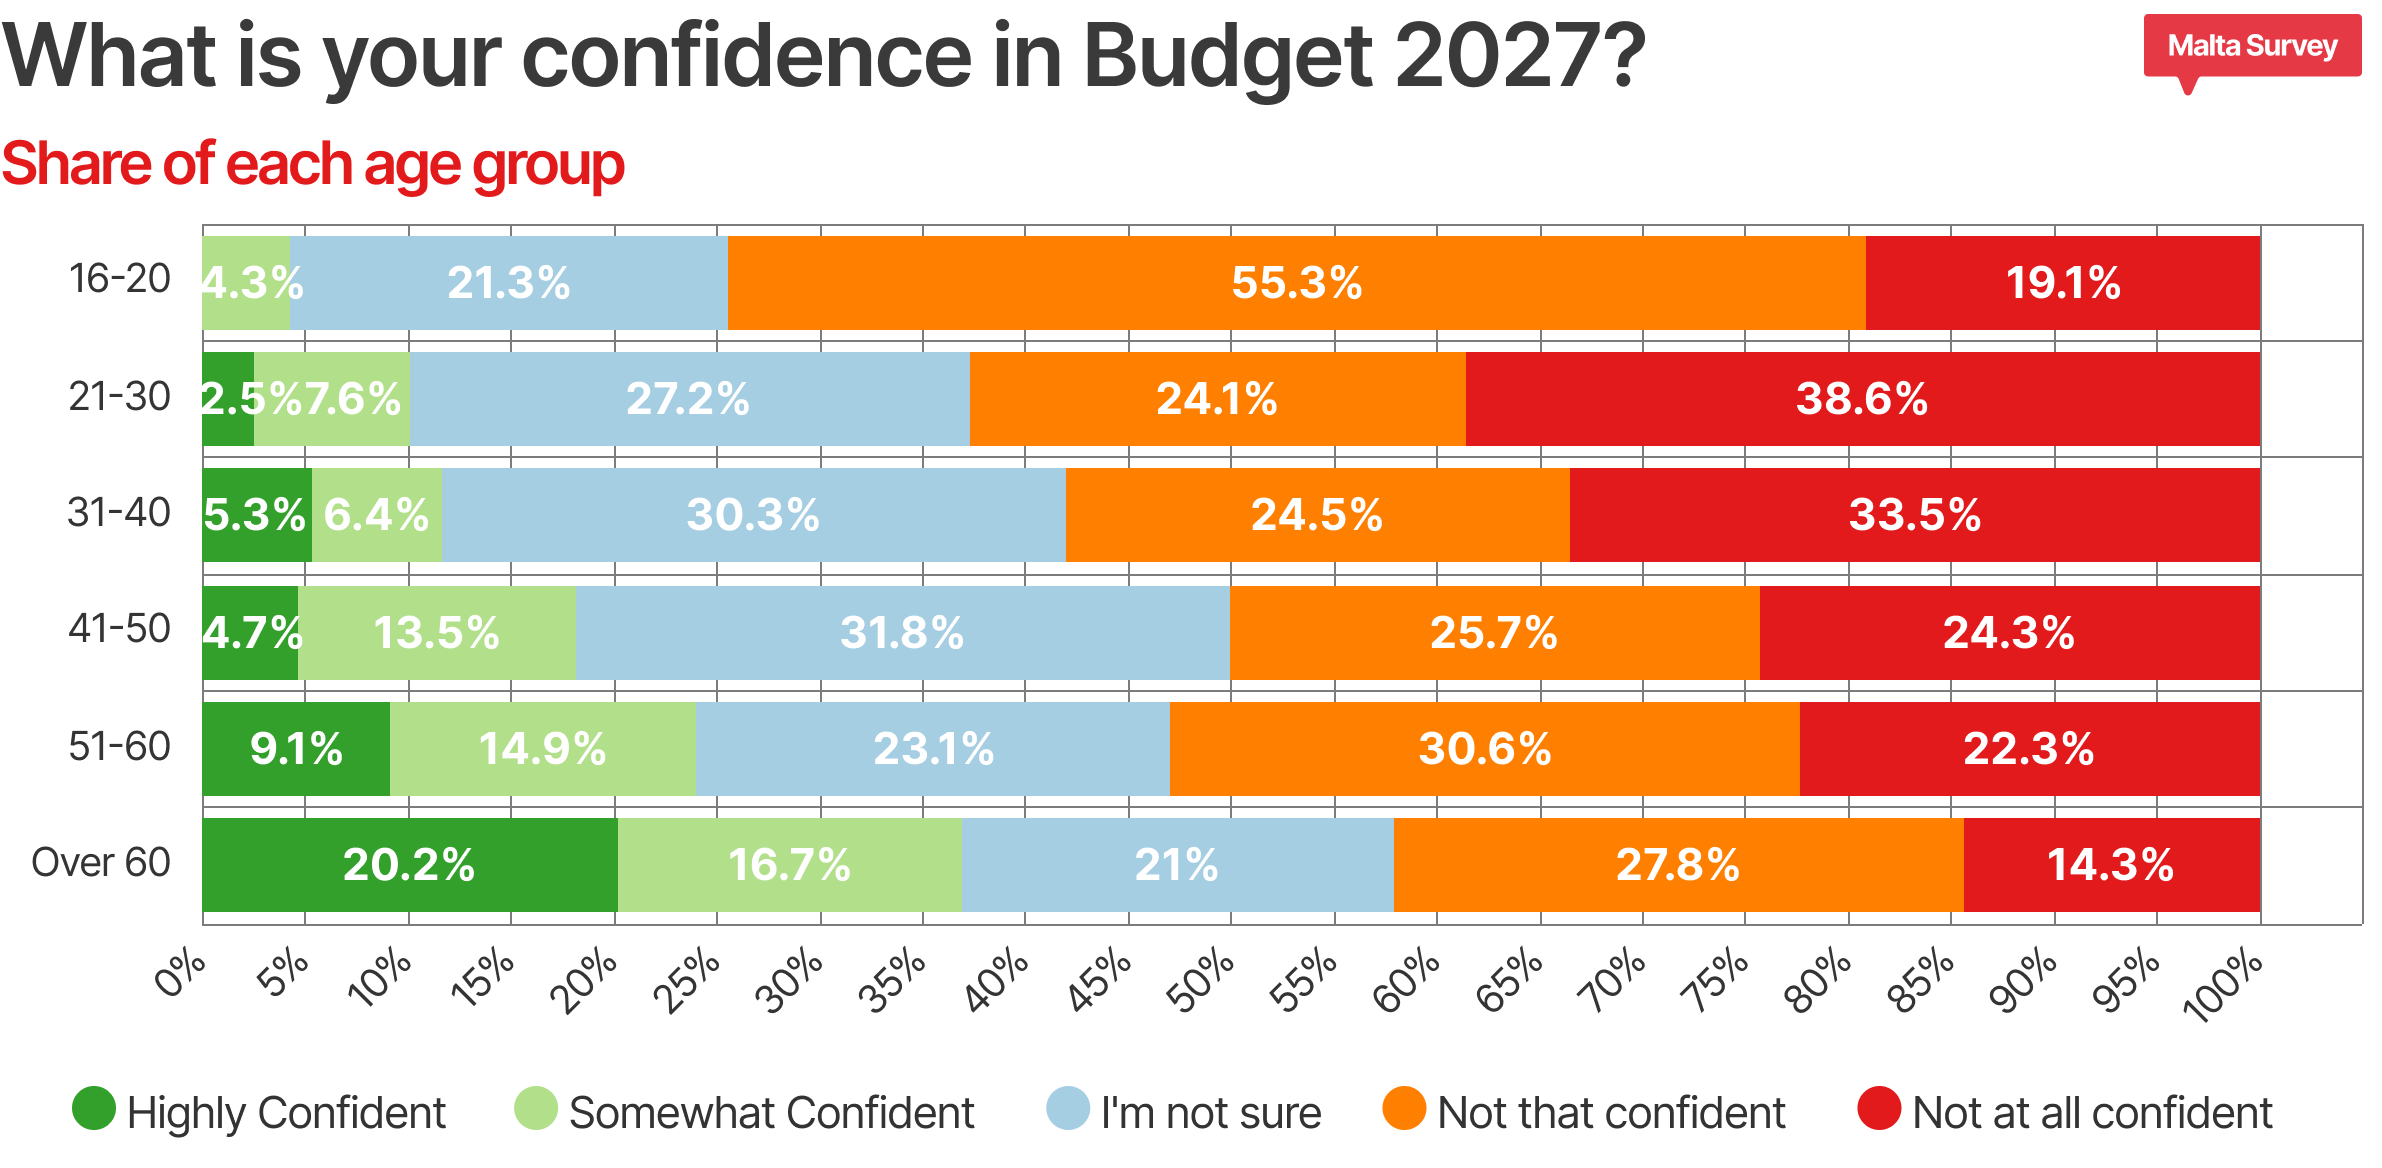
The age breakdown explains much of the overall picture. Confidence rises steadily with age and scepticism falls with it. Among the over-60s, 36.9% are confident, and 42.1% are not. Among 51-60-year-olds, 24% are confident, and 52.9% are not. Below age 50, the picture changes: 18.2% of 41-50-year-olds are confident, while 50% are not. Among 31-40-year-olds, the figures are 11.7% and 58%. The 21-30 group is the most negative in the survey, with 10.1% confident, 62.7% not confident, and 38.6% choosing the most negative option, not at all confident. Among 16-20-year-olds, nobody chose highly confident; 4.3% chose somewhat confident, and 74.4% were not confident. We remind readers that the sampled results have a margin of error, which varies across smaller subsets of the sample.
Compared with last year, every age group has become more sceptical, but the fall is steepest among the young. The share of 21-30-year-olds who are not at all confident has risen from 21.3% to 38.6%, and among 31-40-year-olds from 20.1% to 33.5%. The over-60s, the most confident group last year, remain so, although their share of confident respondents has slipped from 44.5% to 36.9%. The pattern lines up with the priorities section: the groups most concerned about property prices are also the groups least convinced that the budget will deliver.
Conclusion
Five years of asking the same questions makes it possible to separate what stays constant in Maltese public opinion from what changes. Three things are constant. Health is the sector the public most wants funded, by a wide margin, every year. The public’s preferred route to a smaller deficit is for Government to control its own agencies’ spending and to target welfare more tightly, not to raise revenue from households. And measures that benefit businesses rather than households sit at the bottom of every list.
Three things are moving. First, housing has displaced food and wages as the leading cost-of-living concern, and that concern now reaches well beyond the under-30s. Budget 2026 offered support to buyers through the first-time buyer scheme, a higher deposit assistance cap and a wider equity-sharing scheme; the survey suggests the public is now looking for measures that address prices themselves. Second, energy has moved from an afterthought to a top-five sector, while the environment has slipped. Third, and most striking, the confidence recorded before Budget 2026 has dropped. Only one in five respondents expects Budget 2027 to meet their expectations, and among those under 50, it is close to one in ten.
References
- Alwin, D. F., & Krosnick, J. A. (1985). The measurement of values in surveys: A comparison of ratings and rankings. Public Opinion Quarterly, 49(4), 535-552.
- Orme, B. K. (2009). Getting started with conjoint analysis: Strategies for product design and pricing research (2nd ed.). Research Publishers LLC.
- Saaty, T. L. (1977). A scaling method for priorities in hierarchical structures. Journal of Mathematical Psychology, 15(3), 234-281.
- Valliant, R., Dever, J., & Kreuter, F. (2018). Practical Tools for Designing and Weighting Survey Samples (2nd ed.)

